Political Calculations
March 17, 2011
Elephant On the Couch

In looking at the foreign ownership of the U.S. national debt, we realized that we could determine whether a nation is growing or fading in relative economic power by whether or not its share of the U.S. national debt is growing or falling with respect to other nations over time.

As you might imagine, a nation whose relative economic power is on the rise will see its share of the U.S. national debt it might own rise over time, which will most often be a result of it being able to run a trade surplus with the United States for a sustained period of time. Here, the nation running a sustained trade surplus would buy U.S. government-issued debt as a way to help balance the books for its international trade with the United States. The longer that goes on, the larger the share it gains of the U.S. national debt.

We found that that China and Brazil were the two nations whose relative economic power were on the rise during most of the first decade of the twenty-first century.

But in that analysis, we left out the nation whose relative economic power declined the most substantially by that measure - the United States!

Major Holders of U.S. National Debt, March 2000 through December 2010

You can begin seeing what we mean in our first chart, which adds the contributions from U.S. individuals and institutions, individuals such as people who own savings bonds, to institutions, which includes banks, private pension and retirement funds and the Federal Reserve, to the contributions of the U.S. Treasury "borrowing" money from other federal government entities, such as military and civilian government retirement funds and Social Security.

Here, we see that the relative amounts of the U.S. national debt owned by U.S. entities has not grown anywhere near as fast over much of the past decade as the portions owned by foreign powers.

That's especially true for U.S. government pension plans and Social Security, whose ownership of the U.S. national debt has grown at a steady pace over the past decade. By contrast, we see an explosion in the amount of U.S. debt held by all other entities, especially beginning after August 2008 as the financial crisis of that year began.

Our next chart maps the percentage share of the U.S. national debt for each of the indicated debt holders for each month from March 2000 through December 2010 (we're limited to only going back to March 2000 by the U.S. Treasury's available foreign-owned debt data. The percentages shown on the chart indicate each debt holders relative percentage share of the entire U.S. national debt in March 2000 and in December 2010.

Major Holders of U.S. National Debt by Percentage of Debt Held, March 2000 through December 2010

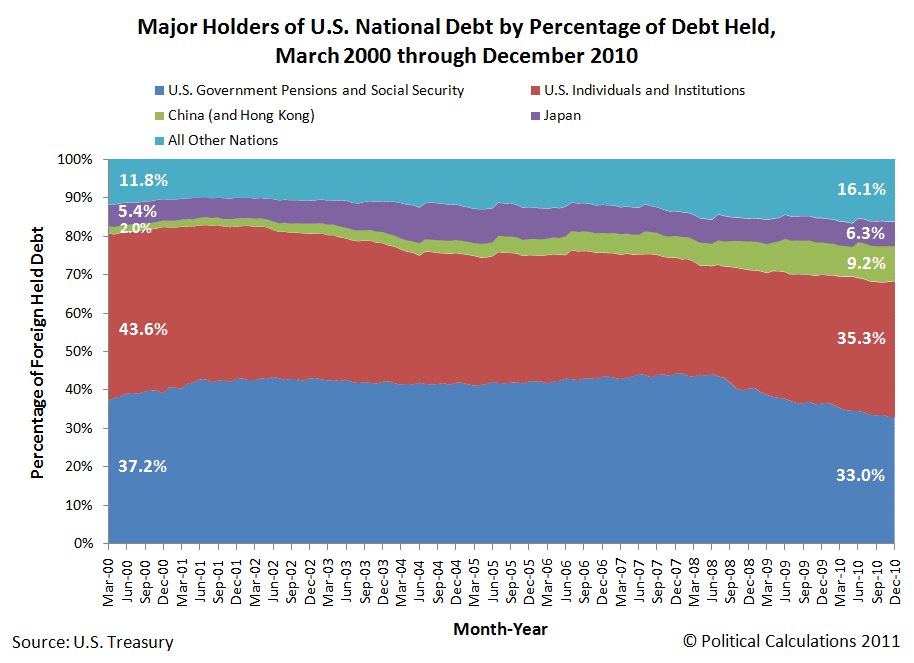
What we see here is that the portion of the U.S. national debt owned by U.S. persons and entities has fallen from the levels of March 2000, while the percentage share held by foreign entities has risen through December 2010. This outcome indicates that the relative economic power of the U.S. has slipped during the period from March 2000 through December 2010, and most dramatically following August 2008.

What's particularly disturbing is that the U.S. trade deficit with China has fallen since August 2008, which means that China's growing share of the U.S. national debt in the time since is not being driven by that nation's trade surplus with the United States and the need to balance the books of that international trade. Instead, it would appear that China's increasing ownership share of the U.S. national debt is aimed at effectively propping up the U.S. government and its spending.

Why China would desire to acquire U.S. debt in excess of what it would seem to need to balance its books to support its international trade is an exercise we'll leave to others. We'll simply observe that they likely believe the policy to be to their advantage in enhancing their relative status with respect to the United States, and so far, there are several indications that suggest that China's enhanced status is being recognized at the highest level.

U.S. President Barack Obama bows before Chinese Premier Hu Jintao

Image Sources: The New Yorker via April Niemela and The Atlantic Council.

Labels: ,


<< Home
Unexpectedly Intriguing!

About Political Calculations


blog advertising
is good for you

Welcome to the blogosphere's toolchest! Here, unlike other blogs dedicated to analyzing current events, we create easy-to-use, simple tools to do the math related to them so you can get in on the action too! If you would like to learn more about these tools, or if you would like to contribute ideas to develop for this blog, please e-mail us at:

ironman at politicalcalculations.com

Thanks in advance!

Recent Posts

Rising and Fading World Powers

To Whom Does the U.S. Government Really Owe Money?...

Repaving The Sidewalk to Nowhere

Adjusted Forecast for the S&P in March 2011

"Pretty Much"

Visualizing the Characteristics of Minimum Wage Ea...

The Minimum Wage and Job Loss from 2006 through 20...

An Actual Improvement in the U.S. Employment Situa...

The New Obamamath

Us, Elsewhere on the Web

Elsewhere on the Web

This year, we'll be experimenting with a number of apps to bring more of a current events focus to Political Calculations - we're test driving the app(s) below!

Most Popular Posts

The S&P 500 at Your Fingertips

The Distribution of Income for 2010: Individuals

Should You Trade in Your Gas Guzzler?

What Are the Chances Your Marriage Will Last?

Tipping Around the World

What's Your Body Fat Percentage?

The Odds of Dying, Again!

Gas Prices, the Unemployment Rate, and Desperation

Hauser's Law

The Real Story Behind "Rising" U.S. Income Inequality

Quick Index

First Time Visitor to Political Calculations?

On the Moneyed Midways

A Lot, But Not All, of Our Tools

U.S. GDP Temperature Gauge

Political Calculations' GDP Temperature Gauge, 2013Q1 First Estimate Political Calculations' U.S. GDP Temperature Gauge provides a means to quickly evaluate the growth rate of the U.S. economy against the backdrop of how the economy has performed since 1980, with the "temperature" color spectrum ranging from a recessionary "cold" (purple) through an expansionary "hot" (red).

The GDP Temperature Gauge presents both the annualized GDP growth rate as reported by the U.S. Bureau of Economic Analysis reports for a one-quarter period and also as averaged over a two quarter period, which smooths out the volatility seen in the one-quarter data and provides a better indication of the relative strength of the U.S. economy over time.

Site Data

This site is primarily powered by:

This page is powered by Blogger. Isn't yours?

Visitors since December 6, 2004:

CSS Validation

Valid CSS!

RSS Site Feed

AddThis Feed Button

JavaScript

The tools on this site are built using JavaScript. If you would like to learn more, one of the best free resources on the web is available at W3Schools.com.

Other Cool Resources

ZunZun - Exceptional regression analysis tool.
Wolfram Integrator - Solve integrals. Do calculus!
Create a Graph - Easy-to-use basic graph-making tool.
Many Eyes - Data visualization extraordinaire!
Wolfram Alpha - Computational knowledge engine.
Khan Academy - Math & science video mini-lectures!
Picasion - Animate images.


Archives
December 2004
January 2005
February 2005
March 2005
April 2005
May 2005
June 2005
July 2005
August 2005
September 2005
October 2005
November 2005
December 2005
January 2006
February 2006
March 2006
April 2006
May 2006
June 2006
July 2006
August 2006
September 2006
October 2006
November 2006
December 2006
January 2007
February 2007
March 2007
April 2007
May 2007
June 2007
July 2007
August 2007
September 2007
October 2007
November 2007
December 2007
January 2008
February 2008
March 2008
April 2008
May 2008
June 2008
July 2008
August 2008
September 2008
October 2008
November 2008
December 2008
January 2009
February 2009
March 2009
April 2009
May 2009
June 2009
July 2009
August 2009
September 2009
October 2009
November 2009
December 2009
January 2010
February 2010
March 2010
April 2010
May 2010
June 2010
July 2010
August 2010
September 2010
October 2010
November 2010
December 2010
January 2011
February 2011
March 2011
April 2011
May 2011
June 2011
July 2011
August 2011
September 2011
October 2011
November 2011
December 2011
January 2012
February 2012
March 2012
April 2012
May 2012
June 2012
July 2012
August 2012
September 2012
October 2012
November 2012
December 2012
January 2013
February 2013
March 2013
April 2013
May 2013

Blog Roll

Bloodhoundblog
Budgets Are Sexy
Cafe Hayek
Carpe Diem
Core77
Coyote Blog
Craig Harper
Darwin's Finance
Digerati Life, The
Division of Labour
Dough Roller, The
Eclectecon
Econlog
Economics Roundtable
EconomicsUK
Environmental Economics
Escape from Cubicle Nation
Execupundit
FiscalGeek
Get Rich Slowly
Gongol
Good Financial Cents
HR Bartender
Hot Air
i4cp Productivity
Innocent Bystanders
Innovation and Growth
Instapundit
Intangible Economy
I've Paid Twice for This Already
Joanne Jacobs
Kaus Files
Len Penzo dot Com
Making Ripples
Market Power
Mechonomics
Mighty Bargain Hunter
Monevator
My Dollar Plan
New Economist
Newmark's Door
Nina Simosko
Physorg
Private Sector Development
Real Clear Politics
Richard Fernandez
Roger L. Simon
Rowan Manahan
Sound Politics
SOX First
Sports Economist, The
squawkfox
Three Star Leadership
Tim Worstall
Townhall
Trusted Advisor
Uncommon Misperceptions
voluntaryXchange
WILLisms
Winterspeak

Market Links

Big Picture, The
Crackerjack Finance
CXO Advisory Group
Disciplined Approach to Investing
Dividend Guy, The
Doug Short
Evidence Investing
Fat Pitch Financials
FX Investment Strategies
Oilprice

Charities We Support

American Red Cross
Children's Heart Foundation
Salvation Army
SMA Foundation

Recommended Reading

Kindle Paperwhite 3G - Best e-reader!
Angel in the Whirlwind
Bailout Nation
Cartoon Guide to Statistics
A Comprehensive Guide to the Peloponnesian War
The Complete Personal Memoirs of Ulysses S. Grant
The Count of Monte Cristo
Ender's Game
Gardner's Art Through the Ages
Empire of Wealth
How to Make Presentations to Councils and Boards
Juran's Quality Handbook
Marks' Standard Handbook
The Second World War
Stocks for the Long Run
Why Smart Executives Fail

Recommended Viewing

The Tudors: The Complete Series

Recently Shopped

Kindle Fire HD 8.9" 4G LTE Wireless 32 GB
Snap Circuits Jr. SC-100
Nerf Vortex Praxis
Sony BRAVIA 40" LED HDTV
2540 Series Docking Station
New Balance MX623
Dunham Men's Waterproof Oxford
TN360 Black Toner Cartridge
The Dangerous Book for Boys
Air Swimmer Remote Control Inflatable Flying Shark
Fisher-Price Little People Lil Pirate Ship

Seeking Alpha Certified