Political Calculations
March 16, 2011
Inspecting the World

Having looked at who the largest holders of the U.S. national debt were at the end of the 2010 U.S. government's fiscal year yesterday, we wondered if we could use some of that data to gain some insight into who the rising powers have been in the world over the past decade, as well as which nations have seen their power fade over that time. Here, it occurred to us that we could measure that change in relative power by seeing which nations used their growing economic strength to acquire larger and larger shares of the U.S. national debt.

So we mined the data the U.S. Treasury has on the foreign ownership of U.S. government-issued debt going back to March 2000 to find out.

Altogether, at the end of the U.S. government's fiscal year in 2010, non-U.S. entities owned 4.324 trillion dollars worth the U.S. government's total public debt outstanding, or rather, 31.9% of the $13.561 trillion that the U.S. government has borrowed from all sources to cover all of its spending through 30 September 2010. That figure represents 47.9% of the total amount of the debt held by the public at that time.

Here's how the the amount of debt held by the largest major foreign holders of the U.S. federal government's debt at the end its 2010 fiscal year has changed from March 2000 through December 2010:

Debt Held by Major Foreign Holders of U.S. National Debt, March 2000 through December 2010

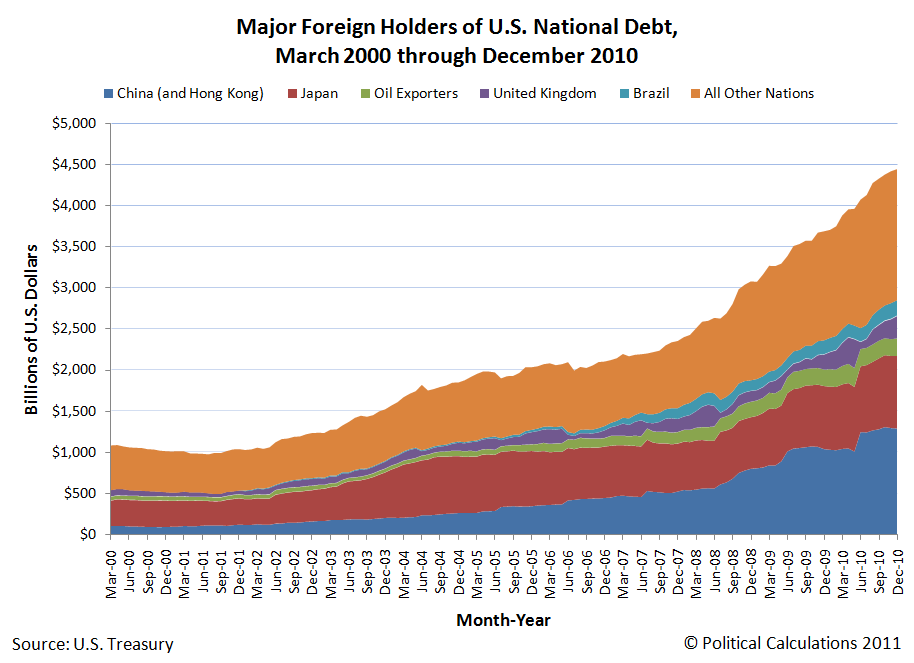
The largest foreign holders of the U.S. national debt on 30 September 2010 were China (mainland and Hong Kong), followed by Japan, "Oil Exporters", the United Kingdom and Brazil.

Let's next take a closer look at the relative percentage share of that foreign-held debt attributed to each of these nations has changed from March 2000 to December 2010:

Major Foreign Holders of U.S. National Debt by Percentage of Foreign Held Debt, March 2000 through December 2010

What we find is that China's share of all the U.S. national debt held by foreign powers and institutions has risen from 10.2% in March 2000 to 29.2% in December 2010. Brazil's relative share of the total portion of the U.S. national debt held by foreign entities has grown from not being large enough to be specifically recorded in either 2000 and 2001 to 4.2% of all the U.S. government's foreign-held debt in December 2010.

Meanwhile, the relative shares for Japan, the United Kingdom, "Oil Exporters" and all other foreign nations has fallen. Japan saw the largest relative share decline for a single nation in going from holding 28.4% of U.S. government-issued debt in March 2010 to 19.9% in December 2010. All other foreign nations combined saw their relative share drop from 50.2% in March 2010 to 35.9% in December 2010.

Looking forward, given the magnitude of the earthquake and tsunami-related destruction in Japan, we should expect that the Japanese will act to cash in a good portion of their U.S. debt holdings to help raise the money that they'll need for recovery, which will further reduce that nation's share of U.S. government-issued debt.

Finally, there is a very large elephant in the room as to which nation has seen its relative share of the U.S. debt change the most over the past decade, which we've left out of this analysis and will get to soon....

Notes

"All Other Foreign Nations" are all those except China (for which we've included Hong Kong), Japan, United Kingdom, Brazil and "Oil Exporters."

"Oil exporters" include Ecuador, Venezuela, Indonesia, Bahrain, Iran, Iraq, Kuwait, Oman, Qatar, Saudi Arabia, the United Arab Emirates, Algeria, Gabon, Libya, and Nigeria.

Data Sources

U.S. Treasury Department. Monthly Statement of the Public Debt of the United States, September 30, 2010. Table III - Detail of Treasury Securities Outstanding, September 30, 2010.

U.S. Treasury Department. Major Foreign Holders of Treasury Securities. (December 2009 through December 2010). Accessed 11 March 2011.

U.S. Treasury Department. Major Foreign Holders of Treasury Securities (March 2000 through December 2009). Accessed 14 March 2011.

Labels:


<< Home
Unexpectedly Intriguing!

About Political Calculations


blog advertising
is good for you

Welcome to the blogosphere's toolchest! Here, unlike other blogs dedicated to analyzing current events, we create easy-to-use, simple tools to do the math related to them so you can get in on the action too! If you would like to learn more about these tools, or if you would like to contribute ideas to develop for this blog, please e-mail us at:

ironman at politicalcalculations.com

Thanks in advance!

Recent Posts

To Whom Does the U.S. Government Really Owe Money?...

Repaving The Sidewalk to Nowhere

Adjusted Forecast for the S&P in March 2011

"Pretty Much"

Visualizing the Characteristics of Minimum Wage Ea...

The Minimum Wage and Job Loss from 2006 through 20...

An Actual Improvement in the U.S. Employment Situa...

The New Obamamath

Us, Elsewhere on the Web

Who Kills Who

Elsewhere on the Web

This year, we'll be experimenting with a number of apps to bring more of a current events focus to Political Calculations - we're test driving the app(s) below!

Most Popular Posts

The S&P 500 at Your Fingertips

The Distribution of Income for 2010: Individuals

Should You Trade in Your Gas Guzzler?

What Are the Chances Your Marriage Will Last?

Tipping Around the World

What's Your Body Fat Percentage?

The Odds of Dying, Again!

Gas Prices, the Unemployment Rate, and Desperation

Hauser's Law

The Real Story Behind "Rising" U.S. Income Inequality

Quick Index

First Time Visitor to Political Calculations?

On the Moneyed Midways

A Lot, But Not All, of Our Tools

U.S. GDP Temperature Gauge

Political Calculations' GDP Temperature Gauge, 2013Q1 First Estimate Political Calculations' U.S. GDP Temperature Gauge provides a means to quickly evaluate the growth rate of the U.S. economy against the backdrop of how the economy has performed since 1980, with the "temperature" color spectrum ranging from a recessionary "cold" (purple) through an expansionary "hot" (red).

The GDP Temperature Gauge presents both the annualized GDP growth rate as reported by the U.S. Bureau of Economic Analysis reports for a one-quarter period and also as averaged over a two quarter period, which smooths out the volatility seen in the one-quarter data and provides a better indication of the relative strength of the U.S. economy over time.

Site Data

This site is primarily powered by:

This page is powered by Blogger. Isn't yours?

Visitors since December 6, 2004:

CSS Validation

Valid CSS!

RSS Site Feed

AddThis Feed Button

JavaScript

The tools on this site are built using JavaScript. If you would like to learn more, one of the best free resources on the web is available at W3Schools.com.

Other Cool Resources

ZunZun - Exceptional regression analysis tool.
Wolfram Integrator - Solve integrals. Do calculus!
Create a Graph - Easy-to-use basic graph-making tool.
Many Eyes - Data visualization extraordinaire!
Wolfram Alpha - Computational knowledge engine.
Khan Academy - Math & science video mini-lectures!
Picasion - Animate images.


Archives
December 2004
January 2005
February 2005
March 2005
April 2005
May 2005
June 2005
July 2005
August 2005
September 2005
October 2005
November 2005
December 2005
January 2006
February 2006
March 2006
April 2006
May 2006
June 2006
July 2006
August 2006
September 2006
October 2006
November 2006
December 2006
January 2007
February 2007
March 2007
April 2007
May 2007
June 2007
July 2007
August 2007
September 2007
October 2007
November 2007
December 2007
January 2008
February 2008
March 2008
April 2008
May 2008
June 2008
July 2008
August 2008
September 2008
October 2008
November 2008
December 2008
January 2009
February 2009
March 2009
April 2009
May 2009
June 2009
July 2009
August 2009
September 2009
October 2009
November 2009
December 2009
January 2010
February 2010
March 2010
April 2010
May 2010
June 2010
July 2010
August 2010
September 2010
October 2010
November 2010
December 2010
January 2011
February 2011
March 2011
April 2011
May 2011
June 2011
July 2011
August 2011
September 2011
October 2011
November 2011
December 2011
January 2012
February 2012
March 2012
April 2012
May 2012
June 2012
July 2012
August 2012
September 2012
October 2012
November 2012
December 2012
January 2013
February 2013
March 2013
April 2013
May 2013

Blog Roll

Bloodhoundblog
Budgets Are Sexy
Cafe Hayek
Carpe Diem
Core77
Coyote Blog
Craig Harper
Darwin's Finance
Digerati Life, The
Division of Labour
Dough Roller, The
Eclectecon
Econlog
Economics Roundtable
EconomicsUK
Environmental Economics
Escape from Cubicle Nation
Execupundit
FiscalGeek
Get Rich Slowly
Gongol
Good Financial Cents
HR Bartender
Hot Air
i4cp Productivity
Innocent Bystanders
Innovation and Growth
Instapundit
Intangible Economy
I've Paid Twice for This Already
Joanne Jacobs
Kaus Files
Len Penzo dot Com
Making Ripples
Market Power
Mechonomics
Mighty Bargain Hunter
Monevator
My Dollar Plan
New Economist
Newmark's Door
Nina Simosko
Physorg
Private Sector Development
Real Clear Politics
Richard Fernandez
Roger L. Simon
Rowan Manahan
Sound Politics
SOX First
Sports Economist, The
squawkfox
Three Star Leadership
Tim Worstall
Townhall
Trusted Advisor
Uncommon Misperceptions
voluntaryXchange
WILLisms
Winterspeak

Market Links

Big Picture, The
Crackerjack Finance
CXO Advisory Group
Disciplined Approach to Investing
Dividend Guy, The
Doug Short
Evidence Investing
Fat Pitch Financials
FX Investment Strategies
Oilprice

Charities We Support

American Red Cross
Children's Heart Foundation
Salvation Army
SMA Foundation

Recommended Reading

Kindle Paperwhite 3G - Best e-reader!
Angel in the Whirlwind
Bailout Nation
Cartoon Guide to Statistics
A Comprehensive Guide to the Peloponnesian War
The Complete Personal Memoirs of Ulysses S. Grant
The Count of Monte Cristo
Ender's Game
Gardner's Art Through the Ages
Empire of Wealth
How to Make Presentations to Councils and Boards
Juran's Quality Handbook
Marks' Standard Handbook
The Second World War
Stocks for the Long Run
Why Smart Executives Fail

Recommended Viewing

The Tudors: The Complete Series

Recently Shopped

Kindle Fire HD 8.9" 4G LTE Wireless 32 GB
Snap Circuits Jr. SC-100
Nerf Vortex Praxis
Sony BRAVIA 40" LED HDTV
2540 Series Docking Station
New Balance MX623
Dunham Men's Waterproof Oxford
TN360 Black Toner Cartridge
The Dangerous Book for Boys
Air Swimmer Remote Control Inflatable Flying Shark
Fisher-Price Little People Lil Pirate Ship

Seeking Alpha Certified