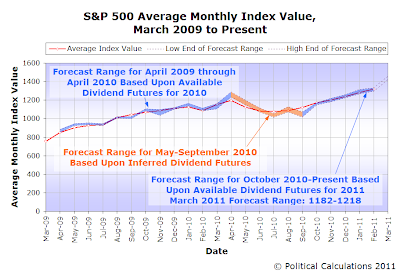
At the beginning of February 2011, we forecast that the S&P 500's average daily closing price for the month of February 2011 would fall somewhere in the range between 1289 and 1321, which we later upped for the month to be in a range between 1294 and 1332.

If you don't mind small fractional remainders, we appear to have been correct on both counts, since the average of the S&P 500's daily closing prices during February 2011 was 1321.12. If you do mind small decimal values tacked onto your integers, then we just barely missed on our prediction at the beginning of the month and hit our updated forecast. Since our plus-minus system for measuring our forecasting accuracy does care about those decimal places, we'll be netting a zero for forecasting where the S&P 500 would be for the month of February, since these results make for a split decision.
Which brings us to the current month of March 2011. Using the expected future dividend payout data that we have available as of 28 February 2011 and assuming typical levels of noise in the market, our math suggests that S&P 500 could rise to reach a range between 1426 and 1456.
To be honest, that potential range seems way too high. And as it happens, it appears to be largely the result of an anomaly in the year-ago historic data that we use as base reference points in our math to project future stock prices. Here, stock prices in March 2010 saw a really nice rebound over what they were in February 2010, which we think is what is skewing our projection to the high side.
In fact, if we just did simple straight line projections in time based on simple inertia using the trend established from October 2010 through February 2011, we would be forecasting that stock prices would fall somewhere between 1336 and 1384 during March 2011.
So if we were betting on our method, we'd take the under. But could the market surprise us to the upside?
As it happens, we can make a pretty good argument that might be the case during this month.

Right now, a good part of what's behind the growth of stock prices is an improving future business outlook for the publicly-traded companies of the S&P 500, which we observe in the widening spreads between the trailing year dividends expected to be paid in future quarters, as at least 47 companies have boosted their dividends during February.
Note: The full list is available at the S&P Indices Market Attributes site, under the heading of S&P 500 Monthly Performance Data, in the Indicated Dividend Changes Excel spreadsheet in the Feb'11 tab. Our readers should note that this data source is not a permanent record, as the data will not be permanently maintained at this source.
In March, it looks like that continuing improvement in the outlook for investors will be tied to the prospect that banks and other major financial institutions will soon begin increasing their cash dividend payouts, which would be capable of providing an significant upward impulse to stock prices.
That's because the financial services sector still makes up the largest percentage share of all companies in the S&P 500 by market capitalization. And because that's the case, this is exactly the kind of change in investor expectations that can have a huge positive impact on stock prices.
In a way, that would be the reverse of the situation that drove the crash of stock prices during 2008 and into 2009.
Consequently, we can't help but notice that there seems to be an awful lot of potential upside in the under!
Update 1 March 2011, 4:21 PM EST: And wouldn't you know the market dove 20.89 today to close at 1306.33 as the price of oil surged, thanks to an apparent increase in unrest in the Middle East. By our methodology, this is what we would describe as a "noise event" - something outside of the future expectations of investors that affects stock prices, which we observe in the changes in the growth rate of dividends per share expected at specific points in the future. Definitely another reason to go for the under this month!...
Labels: dividends, forecasting, SP 500
Welcome to the blogosphere's toolchest! Here, unlike other blogs dedicated to analyzing current events, we create easy-to-use, simple tools to do the math related to them so you can get in on the action too! If you would like to learn more about these tools, or if you would like to contribute ideas to develop for this blog, please e-mail us at:
ironman at politicalcalculations
Thanks in advance!
Closing values for previous trading day.
This site is primarily powered by:
CSS Validation
RSS Site Feed
JavaScript
The tools on this site are built using JavaScript. If you would like to learn more, one of the best free resources on the web is available at W3Schools.com.