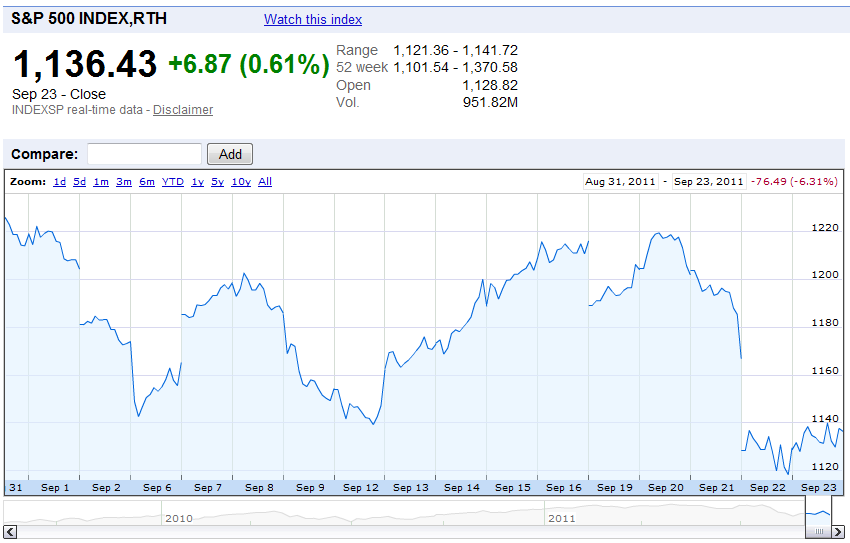
You may have noticed that stock prices have been flailing around quite a lot lately:

What we can tell you is that investors have been reacting to quite a lot of noise in the market, specifically related to what actions the Federal Reserve might take with respect to a new round of quantitative easing.
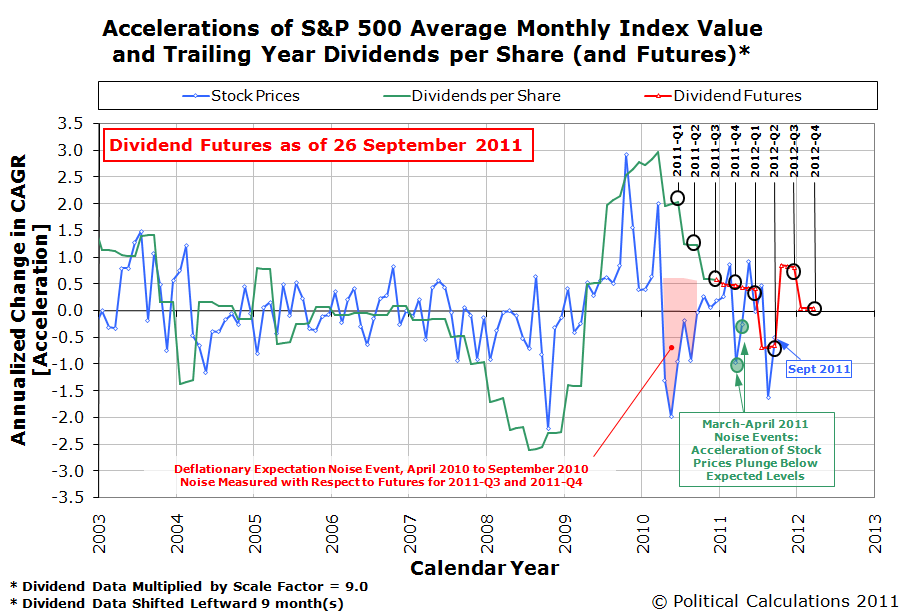
We know that noise is behind the change in stock prices, because the fundamental driver of stock prices, the cash dividends per share that are expected to be paid in the future, have been rising sharply since 12 September 2011:

We know that the change in expectations for what the Federal Reserve will be doing with respect to a new round of quantitative easing because of the timing for when stock prices underwent their most significant change biggest dip for the month on 22 September 2011. Here, when it became apparent that the Federal Reserve would not follow through on the expectation that it would launch QE 3.0 any time soon, stock prices reacted in response.
In this case, stock prices fell because investors had to suddenly factor in the increased potential for deflationary or near-deflationary conditions to re-emerge.
But even with all that noise, the main driver of today's stock prices continues to be the change in the expected rate of growth of dividends per share, specifically those that apply for the second quarter of 2012:

If we had to pick a quarter that would be mostly likely to see recession in the future, it would be the second quarter of 2012. Since a recession would most likely be accompanied by falling prices, there's your most likely source for today's expectations of future deflationary conditions.
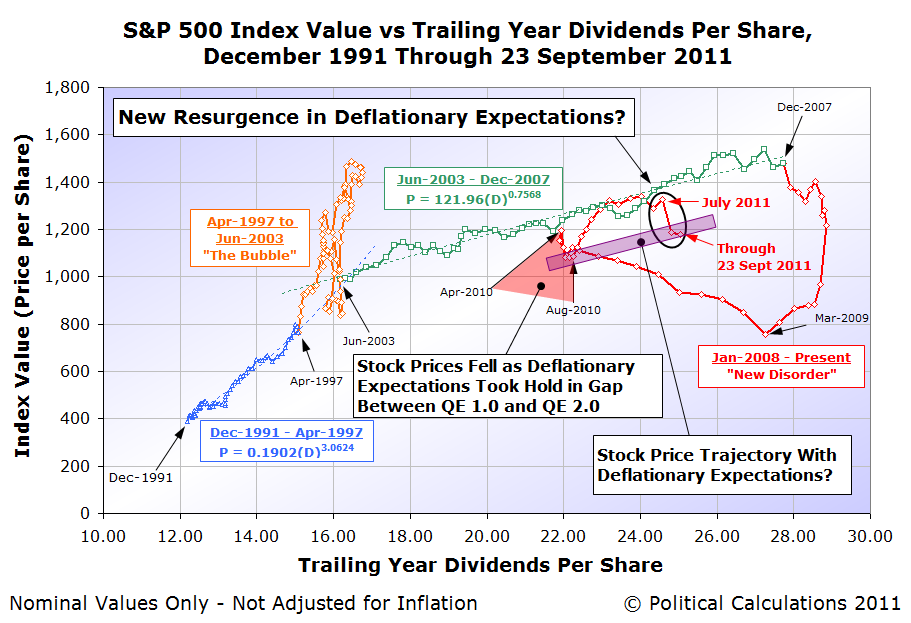
As for what that might mean for stock prices going forward while such expectations exist, consider the following chart:

The trajectory we're showing for stock prices with deflationary expectations runs largely parallel to the trend that existed from June 2003 through December 2007, which was characterized by the expectation of a steady level of future inflation.
Without that expectation of a steady and positive level of future inflation, but rather a steady, but much lower, or near-deflationary level of inflation, we would expect stock prices to follow a parallel trajectory with respect to their dividends per share, provided investors continue to expect rising levels of dividends with passing time.
The wild card then would be changes in the expected level of dividends per share in the future, which could then send stock prices reeling, much like what happened following December 2007.
We'd really like to be able to nail down a real forecast, however we don't yet have the data we would need to be able to quantify the effect of changing expectations of future inflation on stock prices. In that sense, today's market volatility is especially interesting, because it's generating the data we would need to do that.
But then, we're pretty sure that most investors would really rather not be part of our science experiment....
Labels: chaos, SP 500, stock market
Welcome to the blogosphere's toolchest! Here, unlike other blogs dedicated to analyzing current events, we create easy-to-use, simple tools to do the math related to them so you can get in on the action too! If you would like to learn more about these tools, or if you would like to contribute ideas to develop for this blog, please e-mail us at:
ironman at politicalcalculations
Thanks in advance!
Closing values for previous trading day.
This site is primarily powered by:
CSS Validation
RSS Site Feed
JavaScript
The tools on this site are built using JavaScript. If you would like to learn more, one of the best free resources on the web is available at W3Schools.com.