How much does the top income tax rate affect how much money the government collects each year?
That question is relevant today because of the President's latest idea: the "Buffet Rule", which would impose higher income taxes on people who earn over one million dollars a year.
But would the government actually collect more money? Let's find out by doing some math that the President doesn't seem to have done!
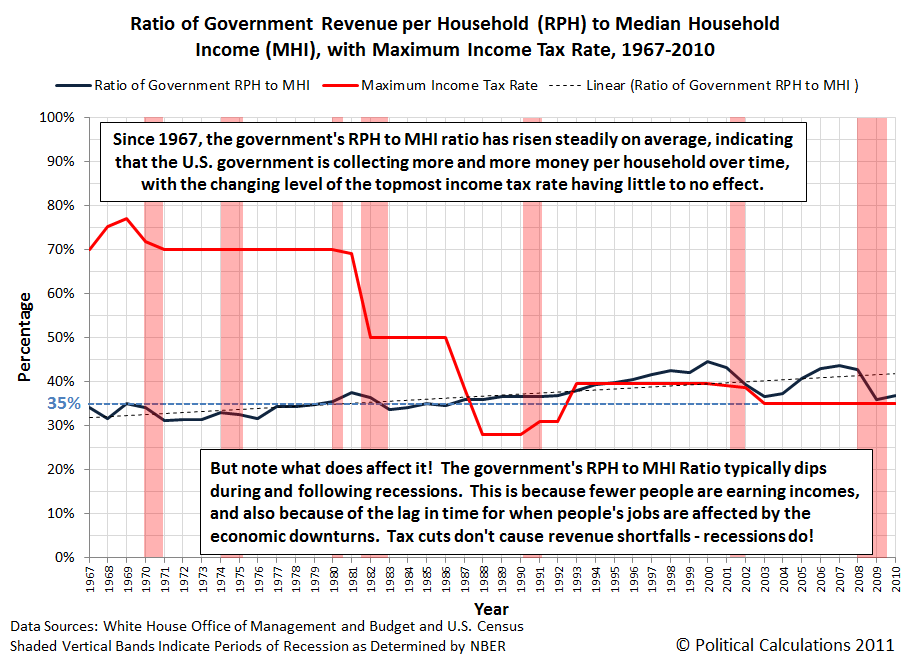
The chart below plots the ratio of total government Revenue Per Household (RPH) to the Median Household Income (MHI) for the U.S. for each year from 1967 through 2010. The chart also plots the maximum income tax rate that the topmost income earners in the United States have had to pay for each year from 1967 through 2010.

The nice thing about the government RPH to MHI ratio is that if the high income earners who are affected by changes in the maximum income tax rate, we'll see it in how the percentage of revenue collected the government per household changes with respect to the median household income changes over time.
Here, if a tax cut really slashes the amount of money that the government collects from these taxpayers, we'll see it show up as a decrease in this ratio following the timing of when a tax cut is implemented. We will likewise see the reverse pattern following a tax hike.
What we do see indicates that the maximum tax rate has little to no bearing on how much money the federal government collects per household in any given year. Since 1967, the government's RPH to MHI ratio has risen steadily on average, indicating that the U.S. government is collecting more and more money per household over time, with the changing level of the topmost income tax rate having little to no effect on the rate of that change.
With that being the case, there is no legitimate reason to set higher income tax rates today, as they are now demonstrated to have little to no effect on how much money the government collects in any given year. Increasing the top income tax rate in the U.S. is simply not an effective strategy for closing the gap between the government's spending per U.S. household and how much it collects in taxes per U.S. household, making any ongoing effort to do so an utter waste of time that could be put to much better use.
As for what does affect the government's RPH to MHI ratio, we would identify two main factors. First, the real progressivity of the U.S. tax system has increased from 1967 through the present (the Tax Foundation shows a snippet of this happening from 2000 to 2005). In other words, those with higher incomes have been paying a increasing share of taxes in the U.S., which is the main factor skewing the overall trajectory of this ratio upward over all this time.
Second, recessions appear to be bad for both billionaires and the government's tax collections. But perhaps that's to be expected when you progressively come to rely too much upon a too small a number of people for your revenue.
So spending a lot of time then to try to make the government become even more dependent upon the random year to year fluctuations of the incomes of a much too small number of people to try to get more money from them would be just plain stupid.
Labels: taxes
Welcome to the blogosphere's toolchest! Here, unlike other blogs dedicated to analyzing current events, we create easy-to-use, simple tools to do the math related to them so you can get in on the action too! If you would like to learn more about these tools, or if you would like to contribute ideas to develop for this blog, please e-mail us at:
ironman at politicalcalculations
Thanks in advance!
Closing values for previous trading day.
This site is primarily powered by:
CSS Validation
RSS Site Feed
JavaScript
The tools on this site are built using JavaScript. If you would like to learn more, one of the best free resources on the web is available at W3Schools.com.