to your HTML Add class="sortable" to any table you'd like to make sortable Click on the headers to sort Thanks to many, many people for contributions and suggestions. Licenced as X11: http://www.kryogenix.org/code/browser/licence.html This basically means: do what you want with it. */ var stIsIE = /*@cc_on!@*/false; sorttable = { init: function() { // quit if this function has already been called if (arguments.callee.done) return; // flag this function so we don't do the same thing twice arguments.callee.done = true; // kill the timer if (_timer) clearInterval(_timer); if (!document.createElement || !document.getElementsByTagName) return; sorttable.DATE_RE = /^(\d\d?)[\/\.-](\d\d?)[\/\.-]((\d\d)?\d\d)$/; forEach(document.getElementsByTagName('table'), function(table) { if (table.className.search(/\bsortable\b/) != -1) { sorttable.makeSortable(table); } }); }, makeSortable: function(table) { if (table.getElementsByTagName('thead').length == 0) { // table doesn't have a tHead. Since it should have, create one and // put the first table row in it. the = document.createElement('thead'); the.appendChild(table.rows[0]); table.insertBefore(the,table.firstChild); } // Safari doesn't support table.tHead, sigh if (table.tHead == null) table.tHead = table.getElementsByTagName('thead')[0]; if (table.tHead.rows.length != 1) return; // can't cope with two header rows // Sorttable v1 put rows with a class of "sortbottom" at the bottom (as // "total" rows, for example). This is B&R, since what you're supposed // to do is put them in a tfoot. So, if there are sortbottom rows, // for backwards compatibility, move them to tfoot (creating it if needed). sortbottomrows = []; for (var i=0; i
The U.S. Bureau of Economic Analysis has revised its initial estimate of GDP in the third quarter of GDP downward. We've adjusted our GDP forecast for the fourth quarter of 2011 accordingly.
Using our preferred Modified Limo method for forecasting GDP, we anticipate that U.S. GDP for the fourth quarter of 2011 has roughly a 68% probability of being between $13,252.9 billion and $13,533.7 billion in terms of constant 2005 U.S. dollars. It has a 99.7% probability of falling between $12,972.5 billion and $13,814.5 billion. The midpoint for our forecast range for GDP in 2011-Q4 using the data available to us now is $13,393.3 billion, in terms of constant 2005 U.S. dollars.
Looking at where U.S. GDP for the third quarter of 2011 has now been adjusted, we note that the midpoint of our forecast range for this quarter is now within 0.28% of where the BEA has revised its GDP estimate.
There will be one more scheduled revision of GDP data for this quarter. We will update our forecast for 2011-Q4 GDP accordingly when this third estimate is released.
Looking backward, our GDP temperature gauges show how the United States' economy has performed over the past three to four quarters with respect to its historical performance since 1980.
|
|
|
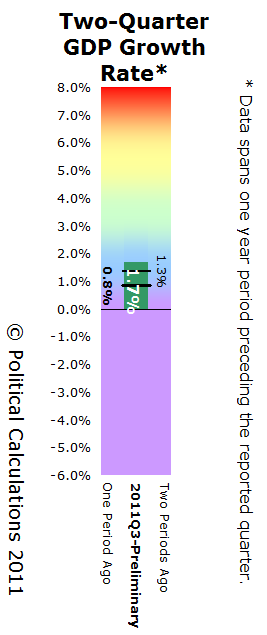
In these charts, the temperature spectrum runs from the "cold" purple range, indicating recessionary conditions, through the "cool" blue range, the "comfortable" green range, which indicates solid economic growth, and on through the more "heated" yellow range on up to the "overheated" red range, which are self-explanatory.
Of these two charts, the Two-Quarter GDP Temperature Gauge provides the better indication of how the U.S. economy has performed over time. We present the One-Quarter GDP Temperature Gauge since its data corresponds to the annualized GDP growth rates reported for each quarter in the media.
Here, the Two-Quarter GDP Temperature Gauge, which covers the two-quarter long intervals of 2010-Q3 through 2011-Q1 (two periods ago), 2010-Q4 through 2011-Q2 (one period ago) and 2011-Q1 through 2011-Q3 (the most recent period) reveals that the U.S. economy over the past year has ranged from recessionary levels, as indicated by the very "cold" purple color to near-recessionary levels, as indicated by the "cool" blue color, which are characterized by lackluster economic growth.
Since the U.S. economy's performance is largely driven by inertia, we anticipate that this lackluster performance will continue well into 2012.
Labels: gdp, gdp forecast
Welcome to the blogosphere's toolchest! Here, unlike other blogs dedicated to analyzing current events, we create easy-to-use, simple tools to do the math related to them so you can get in on the action too! If you would like to learn more about these tools, or if you would like to contribute ideas to develop for this blog, please e-mail us at:
This year, we'll be experimenting with a number of apps to bring more of a current events focus to Political Calculations - we're test driving the app(s) below!
The S&P 500 at Your Fingertips
The Distribution of Income for 2010: Individuals
Should You Trade in Your Gas Guzzler?
What Are the Chances Your Marriage Will Last?
Tipping Around the World
What's Your Body Fat Percentage?
The Odds of Dying, Again!
Gas Prices, the Unemployment Rate, and Desperation
Hauser's Law
The Real Story Behind "Rising" U.S. Income Inequality
First Time Visitor to Political Calculations?
On the Moneyed Midways
A Lot, But Not All, of Our Tools
Political Calculations' U.S. GDP Temperature Gauge provides a means to quickly evaluate the growth rate of the U.S. economy against the backdrop of how the economy has performed since 1980, with the "temperature" color spectrum ranging from a recessionary "cold" (purple) through an expansionary "hot" (red).
The GDP Temperature Gauge presents both the annualized GDP growth rate as reported by the U.S. Bureau of Economic Analysis reports for a one-quarter period and also as averaged over a two quarter period, which smooths out the volatility seen in the one-quarter data and provides a better indication of the relative strength of the U.S. economy over time.
This site is primarily powered by:
Visitors since December 6, 2004:
The tools on this site are built using JavaScript. If you would like to learn more, one of the best free resources on the web is available at W3Schools.com.
ZunZun - Exceptional regression analysis tool.
Wolfram Integrator - Solve integrals. Do calculus!
Create a Graph - Easy-to-use basic graph-making tool.
Many Eyes - Data visualization extraordinaire!
Wolfram Alpha - Computational knowledge engine.
Khan Academy - Math & science video mini-lectures!
Picasion - Animate images.
Bloodhoundblog
Budgets Are Sexy
Cafe Hayek
Carpe Diem
Core77
Coyote Blog
Craig Harper
Darwin's Finance
Digerati Life, The
Division of Labour
Dough Roller, The
Eclectecon
Econlog
Economics Roundtable
EconomicsUK
Environmental Economics
Escape from Cubicle Nation
Execupundit
FiscalGeek
Get Rich Slowly
Gongol
Good Financial Cents
HR Bartender
Hot Air
i4cp Productivity
Innocent Bystanders
Innovation and Growth
Instapundit
Intangible Economy
I've Paid Twice for This Already
Joanne Jacobs
Kaus Files
Len Penzo dot Com
Making Ripples
Market Power
Mechonomics
Mighty Bargain Hunter
Monevator
My Dollar Plan
New Economist
Newmark's Door
Nina Simosko
Physorg
Private Sector Development
Real Clear Politics
Richard Fernandez
Roger L. Simon
Rowan Manahan
Sound Politics
SOX First
Sports Economist, The
squawkfox
Three Star Leadership
Tim Worstall
Townhall
Trusted Advisor
Uncommon Misperceptions
voluntaryXchange
WILLisms
Winterspeak
Big Picture, The
Crackerjack Finance
CXO Advisory Group
Disciplined Approach to Investing
Dividend Guy, The
Doug Short
Evidence Investing
Fat Pitch Financials
FX Investment Strategies
Oilprice
American Red Cross
Children's Heart Foundation
Salvation Army
SMA Foundation
Kindle Paperwhite 3G - Best e-reader!
Angel in the Whirlwind
Bailout Nation
Cartoon Guide to Statistics
A Comprehensive Guide to the Peloponnesian War
The Complete Personal Memoirs of Ulysses S. Grant
The Count of Monte Cristo
Ender's Game
Gardner's Art Through the Ages
Empire of Wealth
How to Make Presentations to Councils and Boards
Juran's Quality Handbook
Marks' Standard Handbook
The Second World War
Stocks for the Long Run
Why Smart Executives Fail
The Tudors: The Complete Series
Kindle Fire HD 8.9" 4G LTE Wireless 32 GB
Snap Circuits Jr. SC-100
Nerf Vortex Praxis
Sony BRAVIA 40" LED HDTV
2540 Series Docking Station
New Balance MX623
Dunham Men's Waterproof Oxford
TN360 Black Toner Cartridge
The Dangerous Book for Boys
Air Swimmer Remote Control Inflatable Flying Shark
Fisher-Price Little People Lil Pirate Ship