Political Calculations
December 19, 2011

Nobody can predict where stock prices will go next, can they? Especially given the volatility of stock prices, especially in today's market, where the market can swing by more than 3% in any given day, right?

It's just not possible, is it?

To really find out, we ran a two-year long experiment, from April 2009 through April 2011, to see if we could forecast the average value of stock prices for a month at the end of the previous month. Here were our final results:

S&P 500 Average Monthly Index Value, April 2009 to April 2011

As you can see, we offered a split final forecast option for April 2011. Here's what we believed would happen instead:

What we believe is likely is that stock prices will track upward from the average level of 1304 they recorded in March 2011 toward the 1393-1429 level our primary method would forecast as the noise currently in the market subsides.

And that's what happened. In April 2011, stock prices did indeed track upward, rising to an average level of 1331 for the month, with the S&P closing the month at 1363.61.

We took the next several months off from offering public forecasts of where the S&P 500 would head next, but by 26 September 2011, we couldn't resist any more, and posted the following chart, which presents a graphical prediction that happens to cover the period through the end of 2011:

S&P 500 Average Monthly Index Value vs Trailing Year Dividends per Share, December 1991 through 23 September 2011

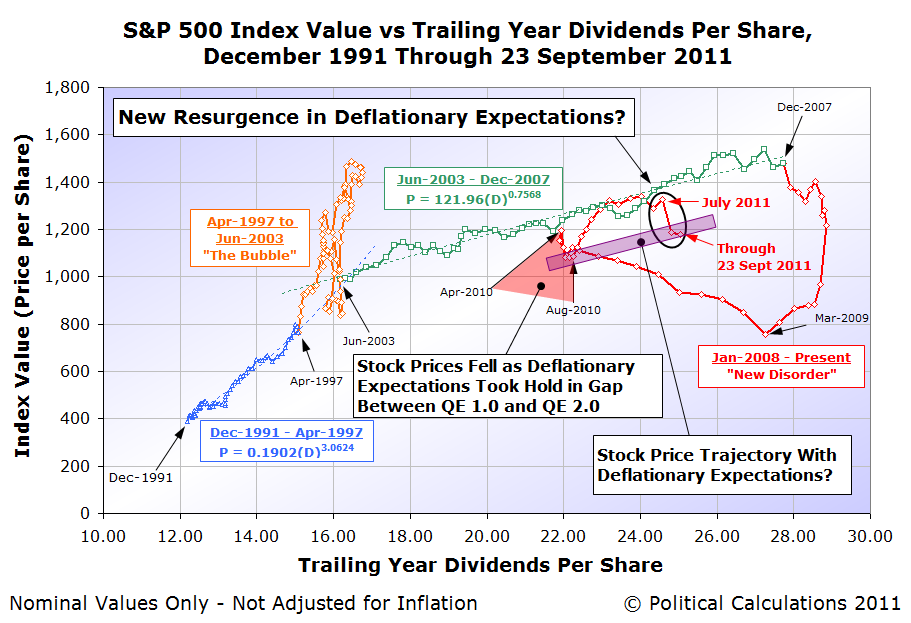
And here's what the updated chart looks like, through the end of 16 December 2011:

S&P 500 Average Monthly Index Value vs Trailing Year Dividends per Share, December 1991 through 16 December 2011

What can we say? We're still in the zone! And that concludes, for real this time, our public experiment in forecasting the future for the S&P 500!

Labels: ,


<< Home
Unexpectedly Intriguing!

About Political Calculations


blog advertising
is good for you

Welcome to the blogosphere's toolchest! Here, unlike other blogs dedicated to analyzing current events, we create easy-to-use, simple tools to do the math related to them so you can get in on the action too! If you would like to learn more about these tools, or if you would like to contribute ideas to develop for this blog, please e-mail us at:

ironman at politicalcalculations.com

Thanks in advance!

Most Popular Posts

The S&P 500 at Your Fingertips

Reckoning the Odds of Recession

Should You Trade in Your Gas Guzzler?

What Are the Chances Your Marriage Will Last?

Tipping Around the World

What's Your Body Fat Percentage?

The Odds of Dying, Again!

The Biggest Issue of 2010, In One Chart

Hauser's Law

Average Lifetime Earnings Trajectories by Education

Quick Index

First Time Visitor to Political Calculations?

On the Moneyed Midways

A Lot, But Not All, of Our Tools

Recent Posts

The Invisible Hand App

Revisiting the U.S. Housing Bubble

How Many Calories Are You Really Eating?

Snapshots of the Expected Future Dividends for the...

U.S.-China Trade: Reaching an Inflection Point

Scheduling the Next U.S. Recession

Your Maximum and Target Heart Rate

Winter 2011 Edition: Who Owns the U.S. National De...

Can Increasing the Minimum Wage Boost GDP?

A Four Year Milestone for U.S. Jobs

U.S. GDP Temperature Gauge

2Q GDP Temperature Gauge - 2011Q3 Second Estimate 1Q GDP Temperature Gauge - 2011Q3 Second Estimate Political Calculations' U.S. GDP Temperature Gauge provides a means to quickly evaluate the growth rate of the U.S. economy against the backdrop of how the economy has performed since 1980, with the "temperature" color spectrum ranging from a recessionary "cold" (purple) through an expansionary "hot" (red).

The GDP Temperature Gauge presents both the annualized GDP growth rate as reported by the U.S. Bureau of Economic Analysis reports for a one-quarter period and also as averaged over a two quarter period, which smooths out the volatility seen in the one-quarter data and provides a better indication of the relative strength of the U.S. economy over time.

Recession Probability Track

Recession Probability Track - 5 November 2007 through 3 November 2011 Political Calculations' Recession Probability Track shows the probability that the U.S. economy will be in recession 12 months from the indicated date (shown in red) while revealing the probability trend over the past four years.

Previously, the probability of recession peaked at 50% on 4 April 2007, which means that March-April 2008 was the most likely period in which the NBER would have found the U.S. to be in recession.

As it happens, they almost did. The NBER instead chose December 2007 as the beginning month of the most recent recession (we had found a 46% probability for a recession beginning in that month!)

The Recession Probability Track ceased to be a leading indicator of recession in the U.S. following the Federal Reserve's adoption of its current Zero Interest Rate Policy, where the Fed artificially constrains short term U.S. Treasury yields near zero percent. We continue to post the Recession Probability Track to monitor the yield on the 10 Year Constant Maturity Treasury, where a falling value provides a leading indication of a worsening economy.

On the Moneyed Midways

Carnival Midway from The Jerk Political Calculations is also the online home of On the Moneyed Midways (aka OMM), a review of the best posts contributed to the week's best business and money-related blog carnivals, which we ran as a regular weekly feature for the five years from 2006 through 2010.

The link below will take you to the running index containing our most recent back issues (you can easily navigate the index to find older editions.)

OMM's Most Recent Editions - with links to our older editions!

Site Data

This site is primarily powered by:

This page is powered by Blogger. Isn't yours?

Visitors since December 6, 2004:

CSS Validation

Valid CSS!

RSS Site Feed

AddThis Feed Button

JavaScript

The tools on this site are built using JavaScript. If you would like to learn more, one of the best free resources on the web is available at W3Schools.com.

Other Cool Resources

ZunZun - Exceptional regression analysis tool.
Wolfram Integrator - Solve integrals. Do calculus!
Create a Graph - Easy-to-use basic graph-making tool.
Many Eyes - Data visualization extraordinaire!
Wolfram Alpha - Computational knowledge engine.
Khan Academy - Math & science video mini-lectures!
Picasion - Animate images.


Archives
December 2004
January 2005
February 2005
March 2005