We weren't planning to revisit the future for the S&P 500's dividends quite so soon, but ExxonMobil's move to boost their cash dividend payments per share by 21% to reclaim the title of being the S&P 500's biggest dividend payer forced our hand!
But that wasn't the only big change, as oil-giant Chevron also announced that it would boost its own cash dividend payments by 11%.
Our first chart shows how the future for the amount of dividends expected to be paid out in the twelve months before the dividend futures contracts for indicated quarters end has changed as a result of ExxonMobil's and Chevron's announcements:

Unlike Apple, who instantly became the second biggest payer of dividends in the S&P 500 index after AT&T when the company announced it would reinstate its long dormant dividend payments, the combination of third-ranked ExxonMobil's 21% increase to move into the top spot with Chevron's smaller 11% increase had a much smaller effect on the market-capitalization weighted cash dividends per share for the S&P 500.
For those who like to see what's in the future for the S&P 500 index as a result of these changes, here's our chart showing the change in the rates of growth of both the S&P 500's average monthly index value and its expected dividends per share:
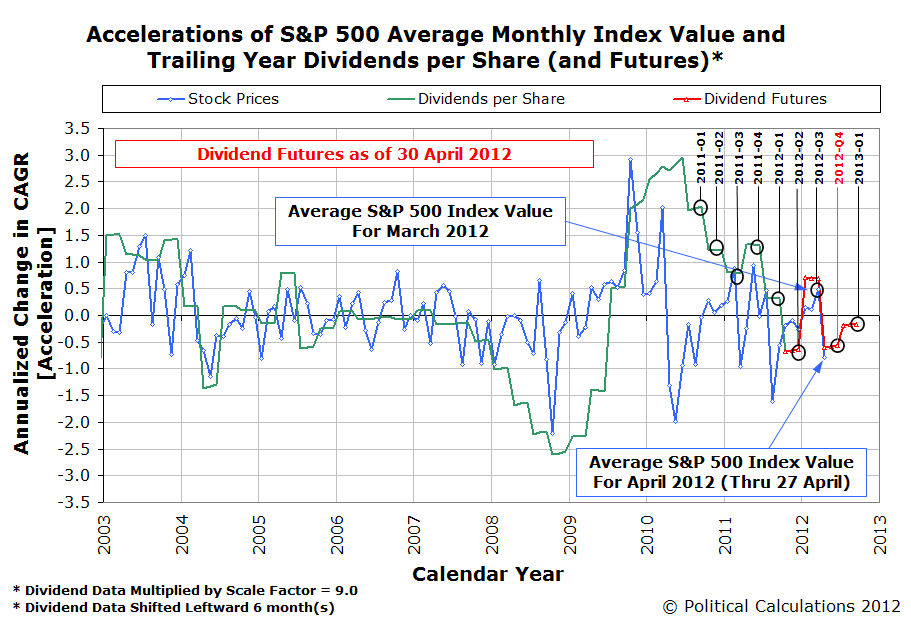
An objective reading of the chart indicates two changes affecting stock prices in the relative absence of noise: one in the very near short term as investors adapt to their just changed expectations for dividend payments that has shifted the future from where it was, and the other playing out in the longer term given their overall expectations for the future. We'll close by noting that investors appear to remain focused on the fourth quarter of 2012 in setting the average level of stock prices for the S&P 500.
Labels: chaos, dividends, SP 500
Welcome to the blogosphere's toolchest! Here, unlike other blogs dedicated to analyzing current events, we create easy-to-use, simple tools to do the math related to them so you can get in on the action too! If you would like to learn more about these tools, or if you would like to contribute ideas to develop for this blog, please e-mail us at:
ironman at politicalcalculations
Thanks in advance!
Closing values for previous trading day.
This site is primarily powered by:
CSS Validation

RSS Site Feed
JavaScript
The tools on this site are built using JavaScript. If you would like to learn more, one of the best free resources on the web is available at W3Schools.com.
Other Cool Resources
Blog Roll


