We think we may finally have a decent handle on how to compensate for the echo effect in our forecasting of the S&P 500's future.

To briefly recap the story to date, our index value forecasting method incorporates historic stock prices from a year earlier as part of the base reference points from which we project the future value of stock prices. The "echo effect" is something that results from our use of that historic data, particularly when stock prices had experienced a "noise event". A noise event is when stock prices deviate from the level that their fundamental underlying driver, the change in the growth rate of their trailing year dividends per share expected at a discrete point of time in the future, would otherwise suggest they should be set according to our model of how stock prices work.
Those deviations from various noise events are clear when you compare what our model had forecast against the actual trajectory that stock prices took in 2013.
We had previously come up with a filtering technique that initially showed promise, but which turned out to not be able to handle the situation where the stock market had undergone a volatile series of disruptive noise events, which was the case from mid-June through mid-October 2013. So we pulled the plug on it last month.
So we seemed to be up a creek without a paddle for compensating for the echo effect in our forecasting. That much is certainly evident when you compare our forecast with the current trajectory of stock prices, where it would appear that the stock market began experiencing a significant negative noise event on 17 July 2014, but which turns out to really be an artifact of the echo effect in our projections - the echo of the noise events of a year ago.

We started thinking about how we recognize the presence of noise in the market in the first place, where we observe it as the deviation from our forecast trajectory of where stock prices would go when investors are focused on a particular point of time in the future. We know what that trajectory looks like and we know what the actual trajectory of stock prices was.
So what if we used our older forecast as the baseline reference for projecting future stock prices?
Well, that wouldn't make much sense, would it? After all, it's a projection, one that was significantly different from the trajectory that stock prices actually took. We shouldn't be in the business of making forecasts based on the hypothetical path that stock prices could have taken a year ago.
But then we thought about it some more. That forecast incorporated the historic stock prices of a year earlier, which are a very real thing that we could use as our baseline point of reference. Instead of using the stock prices of a year ago as the base reference point of our projections, we would instead be using the stock prices of two years ago.
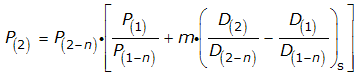
Better still, we wouldn't even need to complicate our basic math like we did with our initial echo filtering technique - we would just need to adjust all the older data points to use the same, but older data that applied at the older point in time. The same math could work!
So that's what we did. Here's the result of our rebaselining the calculation to incorporate the historic stock data in our projections of today:

Suddenly, we find that stock prices would appear to be once again predictable, currently following the trajectories that are consistent with investors continuing to be focused on either 2014-Q3 or 2015-Q2 in setting current day stock prices - just as they were before we ran into the echo effect using our regular one-year ago base reference period!
But now, we appear to have reached a fork for that trajectory, where we'll soon determine which future investors are really focused upon.
Now, there are some obvious downsides with this approach, as in addition to trading the base reference points for our projections, we've also traded one year's noise events for the preceding year's. But since the period of 2012-Q3 was relatively quiet in terms of those events, we should expect stock prices to fall within the expected error range for whichever alternative trajectory that coincide with the actual point of time in the future where investors are currently focused, with any major deviations we observe now being attributable to current day noise events rather than the echoes of noise events past.
Previously on Political Calculations
We've been working on how to crack the echo effect in our S&P 500 forecasting method since November 2013. The posts below, presented in reverse chronological order, describe our experience in that endeavor to date as we've worked out how to compensate for the echo effect in real time.*
- RIP: Our S&P 500 Echo Filtering Technique - 23 June 2014
- Shifting the Future for the S&P 500 - 9 June 2014
- Time to Enter the Summer Doldrums - 2 June 2014
- Echoes, Aftershocks and the S&P 500 - 12 May 2014
- S&P 500: Nothing Much to See Here - 28 April 2014
- An Uneventful Week for the S&P 500 - 21 April 2014
- The Evolving Future of the S&P 500 - 7 April 2014
- Extending the Alternate Futures - 31 March 2014
- A Better Frame of Reference, Mean Reversion and the S&P 500 - 18 March 2014
- Rewriting the Alternate Futures - 10 March 2014
- The S&P 500 in February 2014 - 3 March 2014
- Calibrating the Futures of the S&P 500 - 18 February 2014
- With and Without the Echo - 10 February 2014
- S&P 500: Right About on Target - 20 January 2014
- The S&P 500 Behaving as Expected in the First Week of 2014 - 13 January 2014
- The S&P 500 As We Saw It in Real Time in 2013 - 7 January 2014
- A Last Look at the S&P 500's Future in 2013 and a First Look to 2014 - 16 December 2013
- The S&P 500's Echo-Adjusted Reverberations - 9 December 2013
- The S&P 500 After the Echo Arrives - 3 December 2013
- Filtering the S&P 500's Echoes of the Past, Part 2 - 20 November 2013
- Filtering the S&P 500's Echoes of the Past, Part 1 - 19 November 2013
- The Anniversary of the Great Dividend Raid of 2012 - 18 November 2013
- The S&P 500 Before the Echo Event Begins - 9 November 2013
Reading through all these, we can see why we stuck with our echo-filtering technique for so long, even though we never really liked it very much because of how much it complicated the basic math behind our S&P 500 forecasting method. In the end, it turned out to be capable of compensating for relatively stable short-term echoes, such as from the Great Dividend Raid Rally and the subsequent Fiscal Cliff Deal Rally spanning 15 November 2012 through 17 April 2013, but not the echoes from the much more volatile series of noise events that defined the QE-Uncertainty and Debt Ceiling Crisis noise events that disrupted the U.S. stock market in the period from 19 June 2013 through 17 October 2013.
* Note: To the best of our knowledge, we're the only stock market analysts who have made our work product fully transparent by developing it in public and sharing our observations and results in near-real time on the Internet. And we've been doing it since we announced our original discovery of what really drives stock prices on 6 December 2007.
Welcome back to the cutting edge!
Welcome to the blogosphere's toolchest! Here, unlike other blogs dedicated to analyzing current events, we create easy-to-use, simple tools to do the math related to them so you can get in on the action too! If you would like to learn more about these tools, or if you would like to contribute ideas to develop for this blog, please e-mail us at:
ironman at politicalcalculations
Thanks in advance!
Closing values for previous trading day.
This site is primarily powered by:
CSS Validation

RSS Site Feed
JavaScript
The tools on this site are built using JavaScript. If you would like to learn more, one of the best free resources on the web is available at W3Schools.com.
Other Cool Resources
Blog Roll


