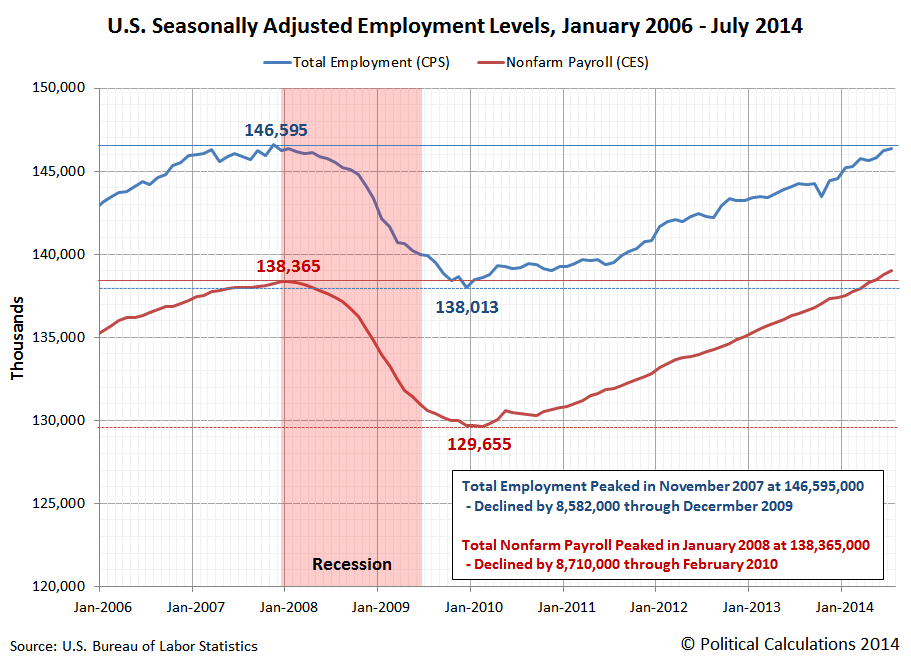
We've long been tracking how American teens, who make up the most marginal of workers in the U.S. economy, have fared with respect to older Americans in the U.S. job market since the total employment level last peaked in November 2007. As you can see in the chart below, things have not gone well at all for the least educated, least experienced and least skilled portion of the noninstitutionalized U.S. civilian labor force.

That's all the more remarkable when you consider how the relative number of marginal jobs has changed throughout this period, as measured by the difference between the total employment level in the U.S. and the number of nonfarm payroll jobs. Our next chart shows how these values have changed from January 2006 through July 2014.
Our next chart shows the difference between these two employment measures over that period of time, which shows the increase in the number of marginal jobs as a result of the recession, which have slowly dwindled as the economy has slowly recovered.
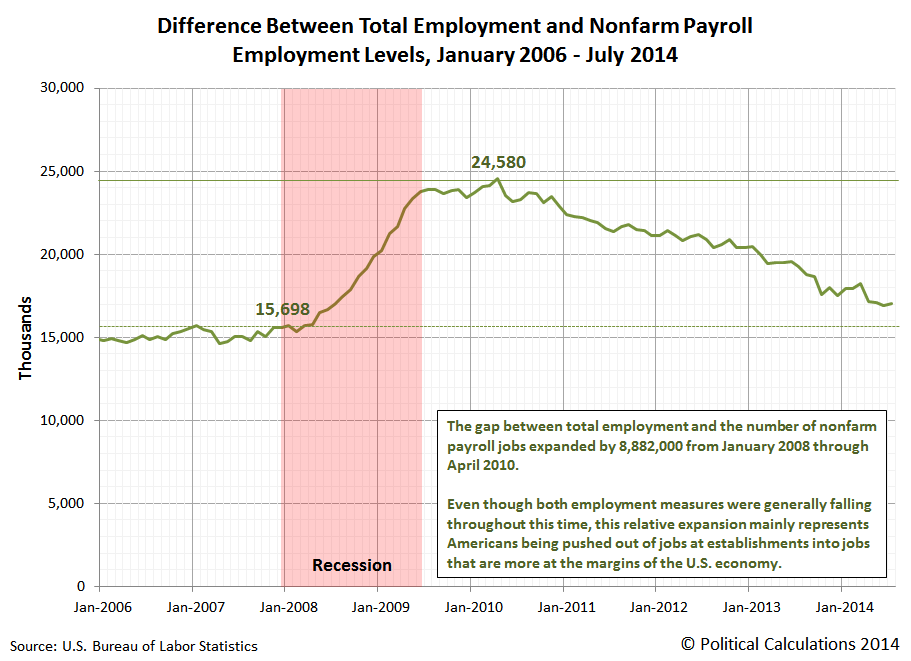
For this span of time, what we're primarily seeing is the change in the number of agricultural workers, self-employed workers whose businesses are unincorporated, unpaid family workers, and private household workers - the employment categories that are represented in the total employment figure but which are excluded from the nonfarm payroll employment figure. These are the kinds of jobs that are, almost by definition, considered to be at the margin of the U.S. economy.
To a much lesser extent, we're also seeing the reduction of employment for people who were working in multiple occupations prior to the recession, since these individuals are counted for each job they hold in the nonfarm payroll measure but are only counted as being employed once in the total employment level.
We say that is to a much lesser extent because the declines in the total employment level and nonfarm payroll employment level during this period of time is roughly equal to one another. But then, we see that the number of marginal jobs in the economy increased by approximately the same amount as these two job measured declined.
That's how we know that Americans who worked at establishments, or rather, established employers, were pushed into more marginal jobs after losing their payroll jobs during the recession. Or perhaps more accurately, after losing their unemployment insurance benefits, which we can observe in the lag between when the biggest job losses occurred during the recession as well as the timing and duration for when marginal employment peaked in the U.S. economy.
Labels: jobs
Welcome to the blogosphere's toolchest! Here, unlike other blogs dedicated to analyzing current events, we create easy-to-use, simple tools to do the math related to them so you can get in on the action too! If you would like to learn more about these tools, or if you would like to contribute ideas to develop for this blog, please e-mail us at:
ironman at politicalcalculations
Thanks in advance!
Closing values for previous trading day.
This site is primarily powered by:
CSS Validation

RSS Site Feed
JavaScript
The tools on this site are built using JavaScript. If you would like to learn more, one of the best free resources on the web is available at W3Schools.com.
Other Cool Resources
Blog Roll


