The U.S. Bureau of Economic Analysis' annual revisions to the Gross Domestic Product data for the nation provides an opportunity to both look backwards and forwards at the United States' GDP as the BEA would have us see it.
Let's first look backwards at the major changes in the BEA's account of the U.S.' national income. Our first chart shows the differences between how GDP was previously reported and how it is now being recorded as having been.
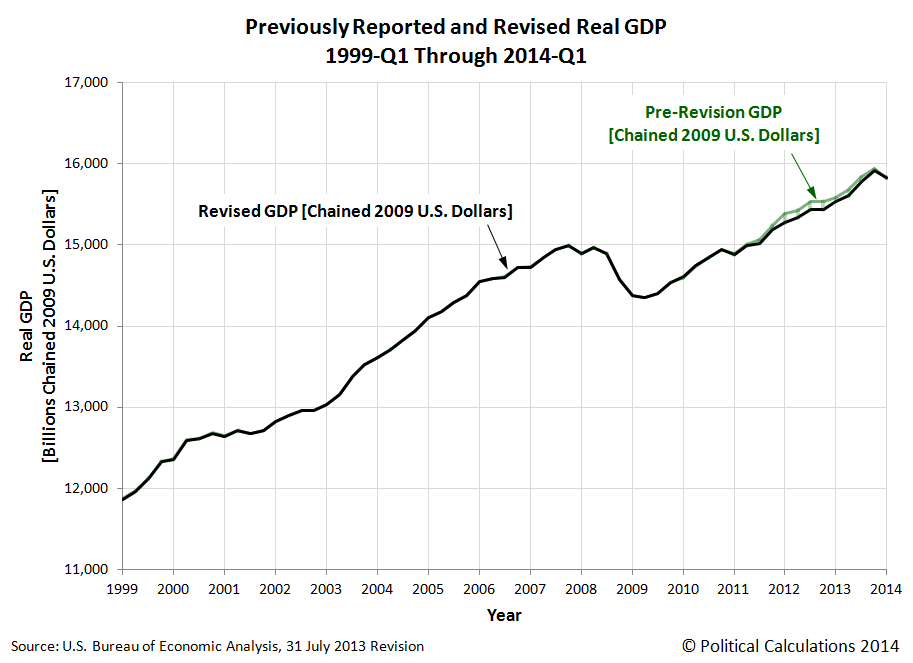
Although the BEA's revision applied to data going back to the first quarter of 1999, from a practical standpoint, most of the changes were concentrated in the period of time since the first quarter of 2011. What we find after the revision is that the U.S. economy did not grow as strongly as the BEA had previously indicated during this time.
The biggest discrepancies occur in the first, third and fourth quarters of 2012, where real GDP was over $100 billion in terms of constant, inflation-adjusted 2009 U.S. dollars below the figures that had previously been recorded. The U.S. economy was skirting the edge of recession in the fourth quarter of 2012, which was the principal reason why the U.S. Federal Reserve re-initiated its Quantitative Easing economic stimulus programs at that time.
Let's next look forward as we'll apply our inertia-based forecasting methods for where the U.S.' real GDP will go next:
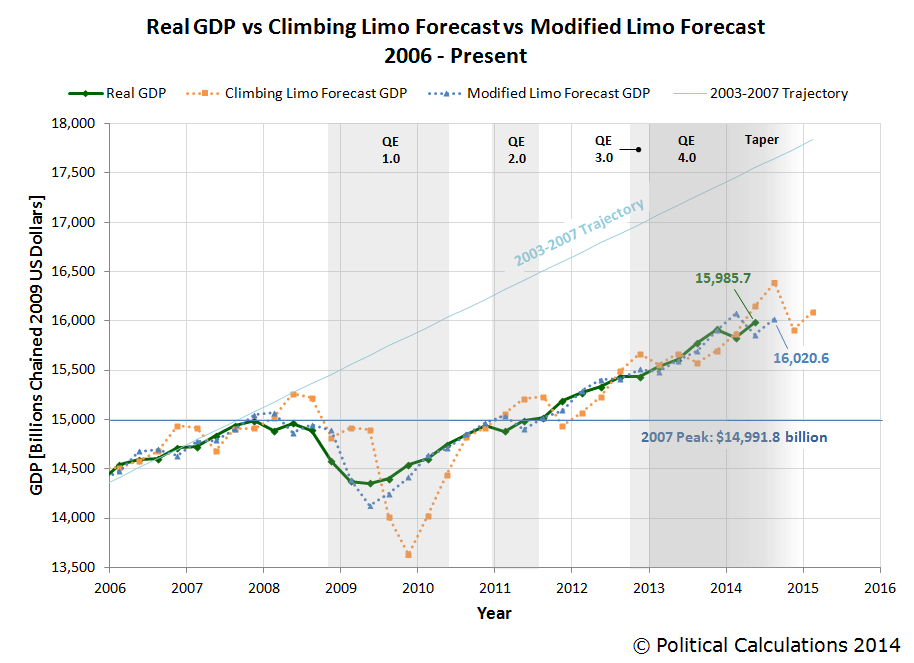
Looking at the just completed quarter of 2014-Q2, we see that our modified limo forecasting technique would set real GDP for the recently expired quarter at $15,857.7 billion, about $128 billion or 0.8% below the BEA's first estimate of GDP for the quarter of $15,985.7 billion in terms of constant 2009 U.S. dollars.

Since the BEA will revise its estimate of this quarter's real GDP two more times before finalizing it pending its annual data revisions, we would anticipate that the BEA's initial estimate will be revised downward.
Looking ahead to the next quarter, 2014-Q3, our modified limo forecasting method would anticipate that GDP will rise in real terms to $16,020.6 billion. Our forecast figure however is partially based on the GDP's first estimate of GDP for 2014-Q2 and will be subject to revision as that figure is itself revised.
But for measuring the current state of the U.S. economy, you can't do much better than our GDP temperature gauges - in particular, our two-quarter gauge:
With an average annualized two-quarter growth rate of 0.9% for each of the last two quarters, the U.S. economy falls into the recessionary "cold" zone of the gauge.
Labels: gdp, gdp forecast
Welcome to the blogosphere's toolchest! Here, unlike other blogs dedicated to analyzing current events, we create easy-to-use, simple tools to do the math related to them so you can get in on the action too! If you would like to learn more about these tools, or if you would like to contribute ideas to develop for this blog, please e-mail us at:
ironman at politicalcalculations
Thanks in advance!
Closing values for previous trading day.
This site is primarily powered by:
CSS Validation

RSS Site Feed
JavaScript
The tools on this site are built using JavaScript. If you would like to learn more, one of the best free resources on the web is available at W3Schools.com.
Other Cool Resources
Blog Roll


