At the beginning of last week, many hours before the opening of the stock market on Monday, 7 October 2014, we did something that nobody else can do: we correctly anticipated where the S&P 500 would close on each and every day of the week within a narrow margin of error using our rebaselined model of how stock prices work. Here is how we closed that post:
Basically, in the absence of a shift in investor focus to a different point of time in the future or new noise events, the market is most likely to move sideways as stock prices largely keep pace with the expectations associated with the future associated with 2015-Q2. Which makes sense because that's the quarter in which the Federal Reserve is most likely to start messing around with short term interest rates.
Now, here's the updated version of the chart showing what our rebaselined chart forecasts for the likely trajectory of stock prices depending upon how far forward in time that investors are looking in setting their expectations:
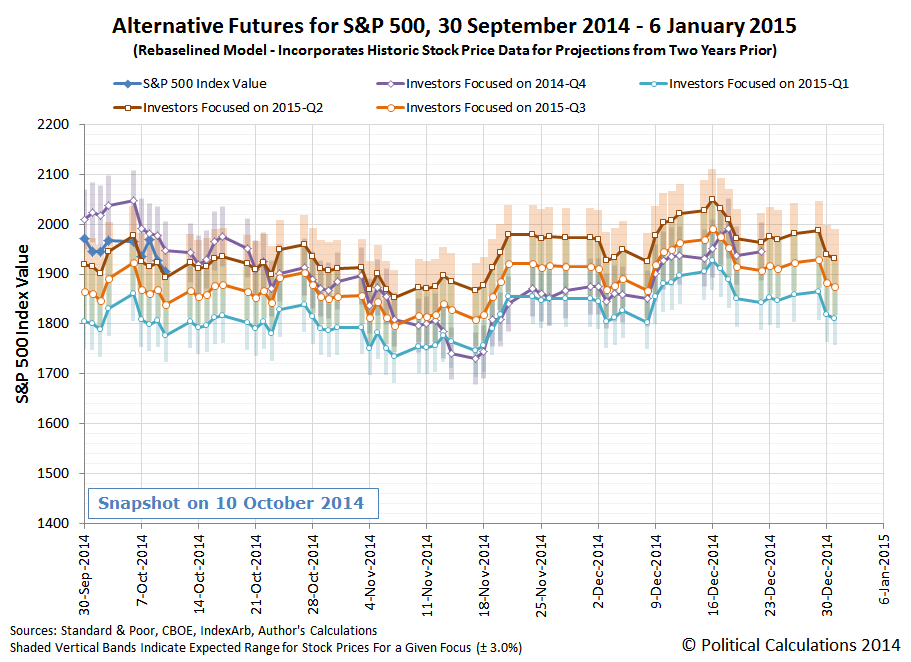
What's important to know is that what we're really doing is forecasting the most likely range into which the S&P 500's stock prices will fall, which is indicated by the shaded, colored vertical bands shown on the chart for each of the future points of time to which investors might focus upon in setting their expectations. Although we have connected the midpoints of these ranges with colored lines, the ranges are what we are really forecasting.
And last week, we would appear to have nailed it. Again. Even with the surprise Fed September 2014 minutes rally on Wednesday, which was really just a very short duration noise event, which we recognized at the time, as stock prices remained within the typical level of noise that we can expect on a day-to-day basis. Let's take a closer look at the market action of the past two weeks:

What we do in charting the future trajectory of stock prices is complex, but not difficult. Which we point out now because we're about to make things a bit less complex for ourselves over the next couple of weeks.
The reason why is because we are finally coming up to the end of the series of large scale noise events that took place during the summer and early fall of 2013, for which we recognized ahead of the fact that our standard model, which incorporates the historic stock price data from a year ago in setting the baseline reference points from which we project future stock prices, would be ill-equipped to handle. The chart below illustrates each of the noise events that threatened to wreck our ability to accurately project the future trajectory of the S&P 500 (shown as the purple-shaded vertical bands shown on the chart):

Over the past year, we developed two different methods for coping with the echo effect in our projections. The first, where we attempted to filter out the echo effect, while having some initial success, ultimately turned out to be a failure. Our second attempt, where we rebaselined our historic stock price reference points, as the results above demonstrate, has proven to be much more successful.
And now, we're nearly to the end of the period of time for which we needed to develop it. Although we're still not quite out of the anniversary period for the third major noise event of 2013, we would anticpate that the following chart will become increasingly relevant over the next several weeks, as the actual trajectory of stock prices should converge with one of the alternative trajectories associated with the expectations for the sustainable portion of earnings (a.k.a. "dividends) at different points of time in the future.

If we had to interpret the chart based upon our standard model today, we would say that stock prices are largely keeping pace with the expectations that investors have for 2015-Q3, but that's without taking the echo effect into account. We'll have to see how things settle out over the next weeks to conclusively identify that future quarter as the focal point for investors.
That period of time is also consistent with the idea that the Federal Reserve will hold off until the middle of the next year to begin hiking short term interest rates, but will likely wait until the third quarter of 2015 to do so until the U.S. economy has had time to recover from the weakening economic situation at the present time.
Previously on Political Calculations
We've been working on how to crack the echo effect in our S&P 500 forecasting method since November 2013. The posts below, presented in reverse chronological order, describe our experience in that endeavor to date as we've worked out how to compensate for the echo effect in real time.*
- The S&P 500 Before the Echo Event Ends - 13 October 2014
- Almost Perfectly Predictible - 8 October 2014
- The Sideways S&P - 6 October 2014
- Split Expectations for the S&P 500 - 29 September 2014
- No Surprises for the S&P 500 - 22 September 2014
- Expectations Shift for the S&P 500 - 15 September 2014
- A Big Ball of Chaos - 4 September 2014
- Tracking Along wit the S&P 500 - 25 August 2014
- Echoes Off with the S&P 500 - 18 August 2014
- In Which We Take On a Pagan Religion - 11 August 2014
- Taking the Fork in the S&P 500's Future - 1 August 2014
- Compensating for the Echo Effect - 28 July 2014
- Shooting Down the Stock Market - 21 July 2014
- Are Investors Nearsighted or Farsighted? - 14 July 2014
- A Moment of Truth for the S&P 500 - 7 July 2014
- The Evolving Future of the S&P 500: 2014-Q2 1 July 2014
- Means, Motive and Opportunity with the S&P 500 - 26 June 2014
- RIP: Our S&P 500 Echo Filtering Technique - 23 June 2014
- Shifting the Future for the S&P 500 - 9 June 2014
- Time to Enter the Summer Doldrums - 2 June 2014
- Echoes, Aftershocks and the S&P 500 - 12 May 2014
- S&P 500: Nothing Much to See Here - 28 April 2014
- An Uneventful Week for the S&P 500 - 21 April 2014
- The Evolving Future of the S&P 500 - 7 April 2014
- Extending the Alternate Futures - 31 March 2014
- A Better Frame of Reference, Mean Reversion and the S&P 500 - 18 March 2014
- Rewriting the Alternate Futures - 10 March 2014
- The S&P 500 in February 2014 - 3 March 2014
- Calibrating the Futures of the S&P 500 - 18 February 2014
- With and Without the Echo - 10 February 2014
- S&P 500: Right About on Target - 20 January 2014
- The S&P 500 Behaving as Expected in the First Week of 2014 - 13 January 2014
- The S&P 500 As We Saw It in Real Time in 2013 - 7 January 2014
- A Last Look at the S&P 500's Future in 2013 and a First Look to 2014 - 16 December 2013
- The S&P 500's Echo-Adjusted Reverberations - 9 December 2013
- The S&P 500 After the Echo Arrives - 3 December 2013
- Filtering the S&P 500's Echoes of the Past, Part 2 - 20 November 2013
- Filtering the S&P 500's Echoes of the Past, Part 1 - 19 November 2013
- The Anniversary of the Great Dividend Raid of 2012 - 18 November 2013
- The S&P 500 Before the Echo Event Begins - 9 November 2013
* Note: To the best of our knowledge, we're the only stock market analysts who have made our work product fully transparent by developing it in public and sharing our observations and results in near-real time on the Internet. And we've been doing it since we announced our original discovery of what really drives stock prices on 6 December 2007.
Welcome back to the cutting edge!
Update 13 October 2014, 8:20 PM EDT: Today's market action is what a shift in focus looks like - where investors suddenly shift their focus from one point of time in the future to another. Or, in terms of our rebaselined chart, from 2015-Q2 to 2015-Q3:

As for why investors shifted their focus to 2015-Q3, well, that's easy. One of the minions at the Federal Reserve indicated that economic weakness would lead the Fed to delay those interest rate hikes, which for the Fed's game of expectations, had been set to occur in the middle of 2015. With evidence of a weakening economy in the present mounting, it wouldn't take much for investors to shift their attention further forward in time as they could reasonably believe the Fed will be forced to delay.
It's a small change, but one with an amplified impact upon stock prices given the nature of how they work.
Remarkably, stock prices are still within our forecast range for 13 October 2014 assuming that investors had been focused on 2015-Q2 in setting today's stock prices - we've gone from one extreme to the other in just a matter of days. Whether this change is just a temporary noise event or actually a sustained shift in focus will become evident over the next several days.
Update 14 October 2014 8:06 AM EDT: From the WSJ - Despite Mixed Risks in U.S., Rate Timing Hasn't Shifted Much. Indeed!
Welcome to the blogosphere's toolchest! Here, unlike other blogs dedicated to analyzing current events, we create easy-to-use, simple tools to do the math related to them so you can get in on the action too! If you would like to learn more about these tools, or if you would like to contribute ideas to develop for this blog, please e-mail us at:
ironman at politicalcalculations
Thanks in advance!
Closing values for previous trading day.
This site is primarily powered by:
CSS Validation

RSS Site Feed
JavaScript
The tools on this site are built using JavaScript. If you would like to learn more, one of the best free resources on the web is available at W3Schools.com.
Other Cool Resources
Blog Roll


