Did you know that there was no open-market price for silver in the United States in the period from 2 April 1792 until 12 February 1873?
It's true! From 2 April 1792 to 27 June 1834, the price of silver was set by the U.S. government so that it would take 15 ounces of silver to be equal to one ounce of gold. Then, in the two and a half years from 28 June 1834 to 17 January 1837, it was reset so that it took 16.002 ounces of silver to equal 1 ounce of gold. And then, from 18 January 1837 through 12 February 1873, it was tweaked slightly so that 15.988 ounces of silver would be equivalent in value to a single ounce of gold.
But after that point in time, except for a dark period that ran from 9 August 1934 until 18 May 1967 when the U.S. acted to nationalize and to artificially set the price of silver in the market, the price of silver has largely been determined through open trading in a worldwide market. Not uncoincidentally, it stopped setting the price of silver almost a year after the U.S. Mint coined its last dimes, quarters and half dollars with the metal.
As an interesting side note, the dimes, quarters and half dollars minted from silver in 1965 and 1966 were made using the same dies created to produce these coins in 1964, so they are marked with that year.
We thought it might make for a fun project to track the average monthly nominal price of silver in terms of U.S. dollars for the period in which it was traded in the open-market. Unfortunately, we were only able to find monthly data back to July 1878, so there is a gap in the historical records that we're still looking to fill (yes, we have the annual data, but it's just not the same). In the meantime, we've begun visualizing the data - our first chart below shows the evolution of silver prices in the period from January 1880 through December 2015 in linear scale, against which we've also shown the periods in which the National Bureau of Economic Research determined the U.S. economy was in recession. In case you're wondering about why 1880 through 2015, it's because graphing a whole 135 years worth of prices is easier than graphing all the 136 years and 8 months worth of prices we were able to collect!
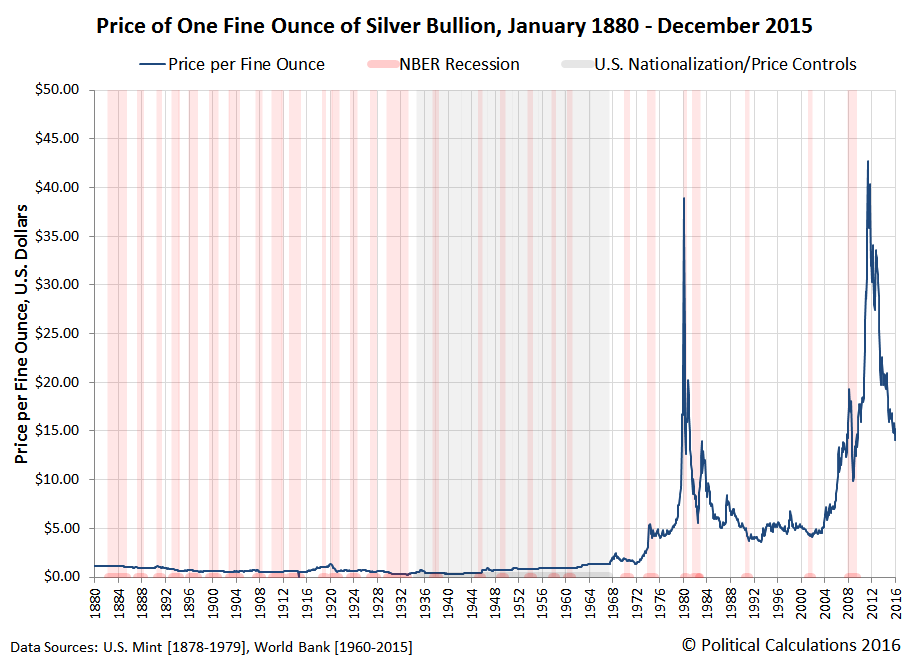
The linear scale in the chart above really doesn't do justice to the changes in silver prices over those 135 years, particularly in the years before 1968, so to get a better sense of the percentage swings that took place over all this time, only a logarithmic scale can properly visualize the story.

And there you have it. Believe it or not, this post is actually part of our Tomato Soup project, where we'll be comparing the nominal prices of the two over their shared history, which should help anyone who doesn't have a firm grasp of why such nominal data is important better understand the kinds of insights that can be gained from both having and presenting it!
Speaking of which, if you would like to use our historic silver price data to support your own projects, just click the link for our Excel spreadsheet. As long as you follow the terms of our copyright in the spreadsheet, we grant you permission to use or reprint both the data in the spreadsheet and charts in this post that are derived from that data as you like! And as a bonus, you'll also find direct links to all the original sources we accessed to obtain the detailed price data.
Update 24 March 2016: For more market history of the price of silver, at least with respect to the price of gold, check out Nathan Lewis' 2013 article The Silver:Gold Ratio, 1687-2011.
In the article, Lewis cites the historic value of silver to gold as being typically between a ratio of 15 or 16 to 1. If we were just looking at the relative abundance of silver and gold in the Earth's crust, the Geological Society of America's Geoscience Handbook estimates the ratio of silver to gold to be 17.5 to 1. While the current edition is available on Amazon, the fifth edition of the handbook is expected to be published in May 2016.
Reference
Political Calculations. Average Monthly Silver Prices. [Excel Spreadsheet]. 22 March 2016. Available data as of 22 March 2016 spans July 1878 through February 2016.
Labels: data visualization, economics, inflation
Welcome to the blogosphere's toolchest! Here, unlike other blogs dedicated to analyzing current events, we create easy-to-use, simple tools to do the math related to them so you can get in on the action too! If you would like to learn more about these tools, or if you would like to contribute ideas to develop for this blog, please e-mail us at:
ironman at politicalcalculations
Thanks in advance!
Closing values for previous trading day.
This site is primarily powered by:
CSS Validation

RSS Site Feed
JavaScript
The tools on this site are built using JavaScript. If you would like to learn more, one of the best free resources on the web is available at W3Schools.com.
Other Cool Resources
Blog Roll


