We're about to go into a long holiday weekend, with something of a mystery to consider, in that it would seem that young adults between the ages of 20 and 24 are vanishing from the state of California.
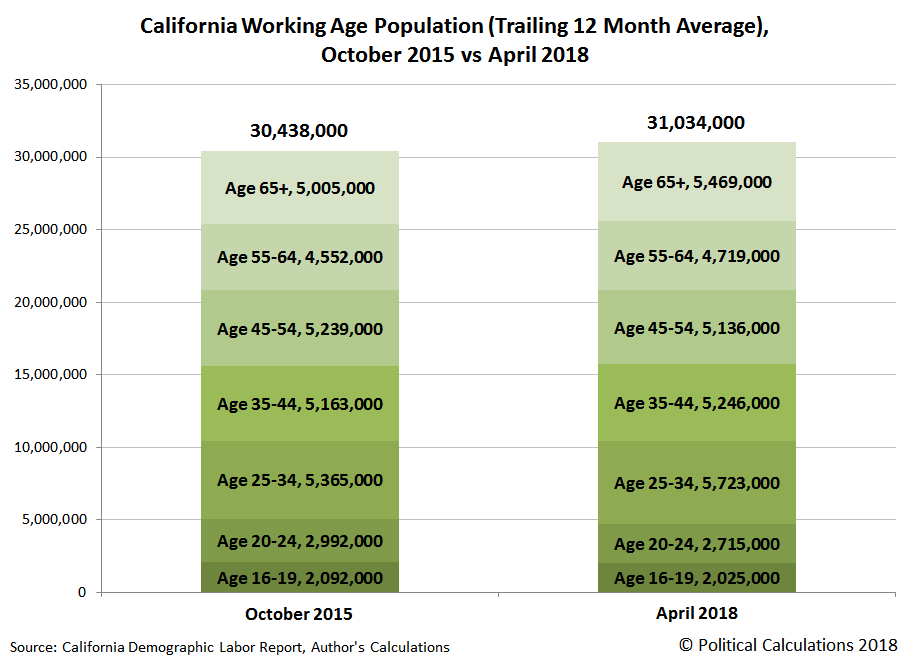
That's according to population data that has been published by the state's Employment Development Department in its monthly Demographic Labor Force Summary Tables, where we find that after reached a peak of 2,992,000 in October 2015, the trailing 12 month average of the state's population of these young adults has been nearly decimated, falling to 2,715,000 in April 2018.
That's not the case for every other age demographic in California's population over the last two and a half years. The following chart shows the overall change the state's population by age group from October 2015 to April 2018.
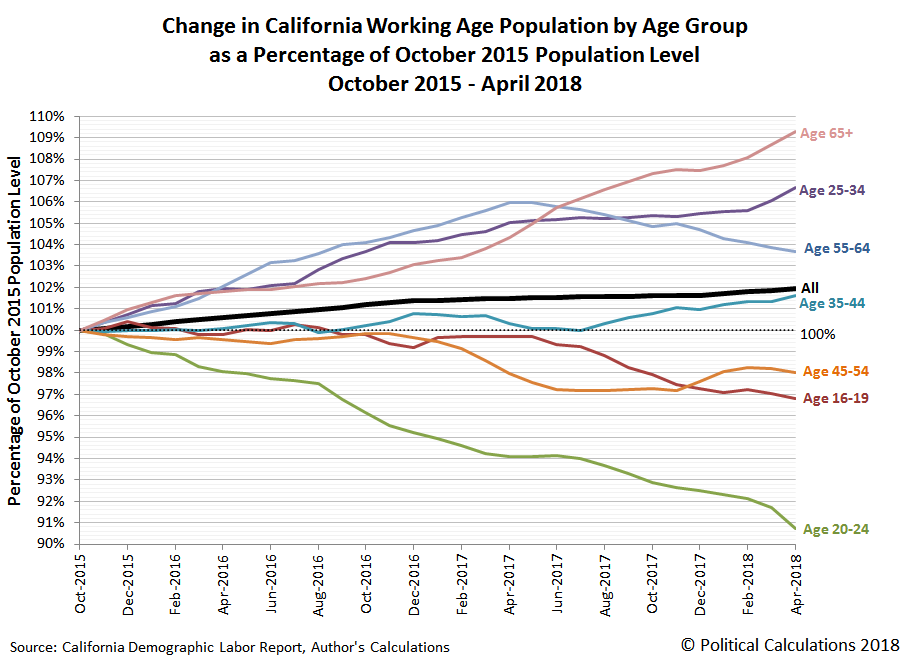
And for the sake of filling in the gaps in between this 31 month span, the following spaghetti chart presents how the population of each of these major age groups has evolved from October 2015 to April 2018 as a percentage of its October 2015 population level, where you can quickly determine which age groups have grown and which have shrunk over that time.
The same phenomenon is showing up in national population data for the U.S. Looking at national data for the Age 20-24 population and rounding to the nearest thousand, we find that there were 22,693,000 young adults in 1 July 2015, which decreased to 22,381,000 by 1 July 2016. Taking advantage of the available cohort population for 2017's Age 20-24 population, we can project that the numbers of this demographic group will continue to decline, with an early estimate of 21,774,000 that would apply for 1 July 2017.
That's a 919,000 decline over two years for the entire U.S., where if we limit California's Age 20-24 population change to an average 24 month period since October 2015, we find that its equivalent population decline over a two year period is 198,000, which would account for 21.5% of the national decline.
Overall, the population of California represents one out of every eight Americans (or 12.5%), so that 21.5% figure seems like a disproportionately large share of a seemingly vanishing population. Fortunately, there's a non-nefarious explanation for why so many Californians between the ages of 20 and 24 are disappearing from the state's population count: the population of this age group within California had been over-represented compared to the rest of the nation in previous years.
In 2015, Californians between 20 and 24 years old made up 13.2% of the nation's total in this age demographic, which has rapidly fallen in the period of time since, where April 2018's population of 2,715,000 young adults in California make up about one out of eight Americans in our early estimate for 2017's population of this group. This portion of the state's population is reverting back to its mean share within the national population.
Meanwhile, the age cohort that produced that over-representated share of Age 20-24 year old Californian among the national population in previous years has aged up into the Age 25-34 group, which is seeing a significant boost in its numbers, and is second only to the state's population of senior citizens (Age 65+).
But perhaps the most amazing thing is how fast the population of Age 20-24 year olds in California has been nearly decimated in such a short period of time. You might normally think of demographic change as something that takes generations to play out, but what's happened in California took place in the amount of time it takes a newborn to grow into a toddler ready to be toilet-trained!
Data Sources
California Employment Development Department. California Demographic Labor Force Summary Tables. [PDF Documents]. October 2015 to April 2018.
U.S. Census Bureau, Population Division. Annual Estimates of the Resident Population by Single Year of Age and Sex for the United States: April 1, 2010 to July 1, 2016. [Online Database]. Release Date: June 2017. Accessed 24 May 2018.
Labels: data visualization, demographics
Welcome to the blogosphere's toolchest! Here, unlike other blogs dedicated to analyzing current events, we create easy-to-use, simple tools to do the math related to them so you can get in on the action too! If you would like to learn more about these tools, or if you would like to contribute ideas to develop for this blog, please e-mail us at:
ironman at politicalcalculations
Thanks in advance!
Closing values for previous trading day.
This site is primarily powered by:
CSS Validation
RSS Site Feed
JavaScript
The tools on this site are built using JavaScript. If you would like to learn more, one of the best free resources on the web is available at W3Schools.com.

