How much of a health benefit can you get for the public by imposing taxes on products like sugary soft drinks?
Advocates for soda taxes frequently cite positive health benefits as the reason for why governments should impose this kind of sin tax on the distribution and sale of sugary beverages to consumers within their jurisdictions. In doing so, many claim that such a tax would fix what in economics is called a "negative externality", which in this case, represents higher costs to public health systems for treating conditions such as obesity and diabetes, where sweetened beverages are targeted by soda tax advocates for their contributions to the problems they proclaim because of their popularity and their sugary calorie content.
But for such an argument to be valid, the imposed tax would have to realistically achieve its desired aims without any unintended consequences that create new costs or other problems that offset any of the realized benefits. Since soda taxes have only been applied in a limited number of jurisdictions in recent years, the data available to assess their impact is relatively limited, so many of these advocates' claims of achievable health benefits have not been able to be challenged.
We do however have evidence from what happened in Philadelphia during the first year of that city's experience with its controversial 1.5-cent-per-ounce soda tax, which it calls the "Philadelphia Beverage Tax". Using monthly tax collection data compiled by the Philadelphia Department of Revenue, and the city's expectation for what would be its annual revenue from the tax and its predicted reduction in sweetened beverage sales, we are able to identify the amount of soda that was distributed for sale in Philadelphia in 2017 and also how much city officials believe would have been distributed in the absence of its soda tax. The following chart shows those results.
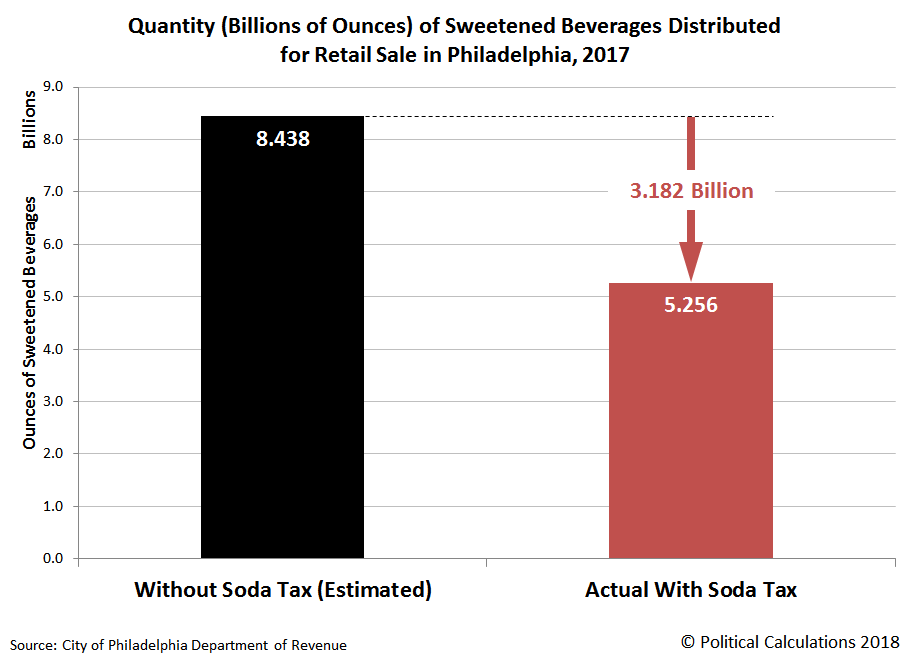
In the next chart, we've simply tallied up the monthly data for the number of ounces of sweetened beverages subject to the Philadelphia Beverage Tax to get the picture for the quantity of beverages that would have been distributed for sale in the city without the tax and also the amount of what was actually distributed in the city after the tax was imposed on 1 January 2017.
In this second chart, we see that the Philadelphia Beverage Tax reduced the amount of diet and regular sweetened beverages in the city by the equivalent of 3.182 billion ounces in 2017, which is quite a lot, but should be expected to happen whenever a tax imposed by a government causes the price of a product that consumers buy to increase substantially. From here, we'll need to do some math to estimate how much that works out to be in potential calorie reduction.
So we built a tool to do that math! The following tool will estimate the reduction in consumed calories from the implementation of the Philadelphia Beverage Tax on a per capita basis, where we've added a factor to account for the share of non-diet "regular" beverages that are consumed each year, since these are where the vast bulk of the sugary calories are to be found. If you're reading this article on a site that republishes our RSS news feed, please click here to access a working version of this tool. If you would rather not click through, you can view a screenshot of the tool's results with the default data.
Using the default data in our tool, we find that the reduction in the amount of sweetened beverages distributed in Philadelphia would have been sufficient to reduce the weight of every man, woman and child in the city by five pounds, assuming that none of these people increased their consumption of other calorie containing beverages and foods, and also assuming that they didn't leave the city to buy sweetened beverages that were not subjected to the city's controversial soda tax, or acquired them from bootleggers who smuggled them in.
We've already run the numbers for the increased calories of alcohol-based beverages sold within the city, whose sales surged during 2017, which totaled the equivalent of an additional 114 12-ounce containers of beer consumed by each Philadelphian over the year. Assuming 149 calories per container per person, the average Philadelphian consumed an additional 16,986 calories during 2017. With 3,500 calories corresponding to the gain or loss of a pound of body weight, that increased alcohol consumption would, when spread over every man, woman and child in the city, put an average of 4.9 pounds back onto the bodies of every Philadelphian! [In reality, a larger amount of weight would be gained by the legal drinking age portion of the city's population, but you get the idea....]
When you consider that we haven't yet accounted for sweetened beverage consumers shifting their shopping to outside the city to avoid the Philadelphia Beverage Tax, or the smuggling of untaxed soda into the city for sale by bootleggers, it's pretty clear that Philadelphia's soda tax failed as meaningful health improvement measure for the city's population, where the average calorie consumption per capita almost certainly was either flat or rising during 2017.
One detailed marketing study found that sales of sweetened beverages increased by anywhere from 5% to 38% depending on beverage type in Philadelphia's suburbs during the first five months the tax was in effect, but we don't know the net extent to which this increased sales volume of sweetened beverages not subject to Philadelphia's soda tax offset reduced sales in the city for the full year. In our tool, we initially set the default value of the tax avoidance factor to 0%, but we believe a conservative estimate would fall between 10% and 20% - you're more than welcome to substitute these percentages or your own estimate into our tool to take this particular factor more realistically into account.
Update 12 October 2018: 10-20% proved to be a very conservative estimate - based on new information that was published after this article, the actual share may be in the ballpark of 59%-79%, where we would again seek to err toward the low side of the estimate.
Other factors that we're not considering is the extent to which reduced soft drink consumption may have offset by purchases of bottled water and untaxed packets of sweetened drink powders, where consumers could blend their own calorie-rich sugary beverage. Likewise, we're also not considering whether consumers in the city, instead of buying taxed soda pop, instead opted to increase their consumption of any of the many inexpensive, calorie-laden treats that are exempt from Philadelphia's soda tax to satisfy their sweet tooth.
Since reduced calorie consumption would have provided the primary health benefit of having imposed such a tax, the absence of any significant reduction would mean that no positive benefits through reduced medical costs for the treatment of excessive calorie consumption-related health conditions were realized on average among Philadelphia's population as a result of the city's soda tax. But then, since the Philadelphia Beverage Tax was never intended to improve the health of Philadelphians, this outcome should not be a surprise.
Welcome to the blogosphere's toolchest! Here, unlike other blogs dedicated to analyzing current events, we create easy-to-use, simple tools to do the math related to them so you can get in on the action too! If you would like to learn more about these tools, or if you would like to contribute ideas to develop for this blog, please e-mail us at:
ironman at politicalcalculations
Thanks in advance!
Closing values for previous trading day.
This site is primarily powered by:
CSS Validation
RSS Site Feed
JavaScript
The tools on this site are built using JavaScript. If you would like to learn more, one of the best free resources on the web is available at W3Schools.com.


