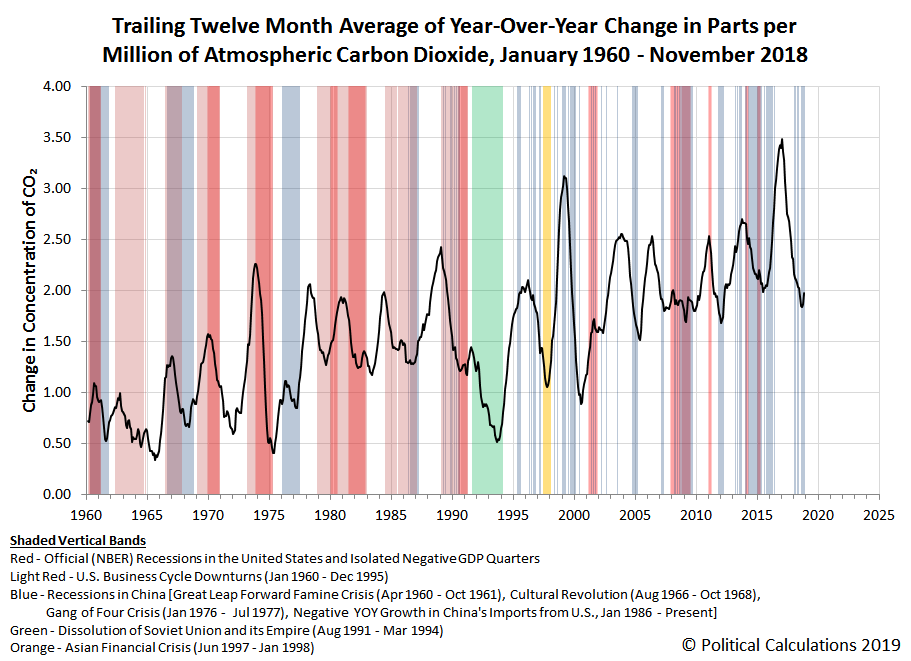
It has been a while since we last visited the NOAA's atmospheric carbon dioxide concentration data, which we're interested in as a unique indicator of the relative health of the Earth's global economy. The following chart illustrates the trailing twelve month average of year-over-year changes in the level of CO2 from January 1960 through November 2018, the last month for which the data is available at this writing.
Following the very strong El Nino event of 2015-2016, which spurred a spike in atmospheric carbon dioxide levels well into 2017, the rate at which CO2 is increasing in the Earth's air has plunged to levels last seen during the Great Recession from 2008 through 2009 and during a subsequent global economic slowdown in 2011-2012, which was particularly notable in China, the world's largest national emitter of carbon dioxide, whose economy has shown signs of another significant slowdown in 2018.
For its part, the world's second-largest national emitter of carbon dioxide, the United States, whose total emissions are a little over half of China's, likely experienced a year-over-year increase in its total CO2 output.
America’s carbon dioxide emissions rose by 3.4 percent in 2018, the biggest increase in eight years, according to a preliminary estimate published Tuesday.
Strikingly, the sharp uptick in emissions occurred even as a near-record number of coal plants around the United States retired last year, illustrating how difficult it could be for the country to make further progress on climate change in the years to come, particularly as the Trump administration pushes to roll back federal regulations that limit greenhouse gas emissions.
The estimate, by the research firm Rhodium Group, pointed to a stark reversal. Fossil fuel emissions in the United States have fallen significantly since 2005 and declined each of the previous three years, in part because of a boom in cheap natural gas and renewable energy, which have been rapidly displacing dirtier coal-fired power.
Yet even a steep drop in coal use last year wasn’t enough to offset rising emissions in other parts of the economy. Some of that increase was weather-related: A relatively cold winter led to a spike in the use of oil and gas for heating in areas like New England.
But, just as important, as the United States economy grew at a strong pace last year, emissions from factories, planes and trucks soared. And there are few policies in place to clean those sectors up.
“The big takeaway for me is that we haven’t yet successfully decoupled U.S. emissions growth from economic growth,” said Trevor Houser, a climate and energy analyst at the Rhodium Group.
Indeed, the lack of such decoupling almost everywhere in the world is why we're able to use atmospheric carbon dioxide data to assess the relative health of the world's economy. Meanwhile, the U.S.' apparent increase in CO2 emissions as its economy has grown in 2018 stands in contrast to the negative economic situation developing elsewhere in the world, which could soon contribute to dragging the U.S. economy down now that the main period of benefit from the stimulus of its December 2017 tax cuts has passed. John Whitehead puts the apparent spike in U.S. carbon dioxide emissions into a longer term context:
The headline is likely an overstatement. Did emissions spike? Emissions in 2018 are still below the pre-Great Recession peak and below several years since the decline began (again, due to the Great Recession). There may be some sort of cyclical pattern here too. In other words, there have been three "spikes" since the peak. The most recent may be related to the 2018 tax cut. As that wears off we might get closer to the Copenhagen Accord target in 2019 and a recession in 2020 might really nail it.
Like it or not, the health of the world's economy will be correlated with atmospheric carbon dioxide levels for quite some time to come.
References
National Oceanographic and Atmospheric Administration. Earth System Research Laboratory. Mauna Loa Observatory CO2 Data. [File Transfer Protocol Text File]. 6 December 2018.
Labels: data visualization, economics
Welcome to the blogosphere's toolchest! Here, unlike other blogs dedicated to analyzing current events, we create easy-to-use, simple tools to do the math related to them so you can get in on the action too! If you would like to learn more about these tools, or if you would like to contribute ideas to develop for this blog, please e-mail us at:
ironman at politicalcalculations
Thanks in advance!
Closing values for previous trading day.
This site is primarily powered by:
CSS Validation
RSS Site Feed
JavaScript
The tools on this site are built using JavaScript. If you would like to learn more, one of the best free resources on the web is available at W3Schools.com.
