After having held relatively steady in recent months, new home sale prices have resumed falling. The chart below shows the raw median and average new home sale prices reported by the U.S. Census Bureau since January 2000, where we have to go back to early January 2017 to find similarly low prices.
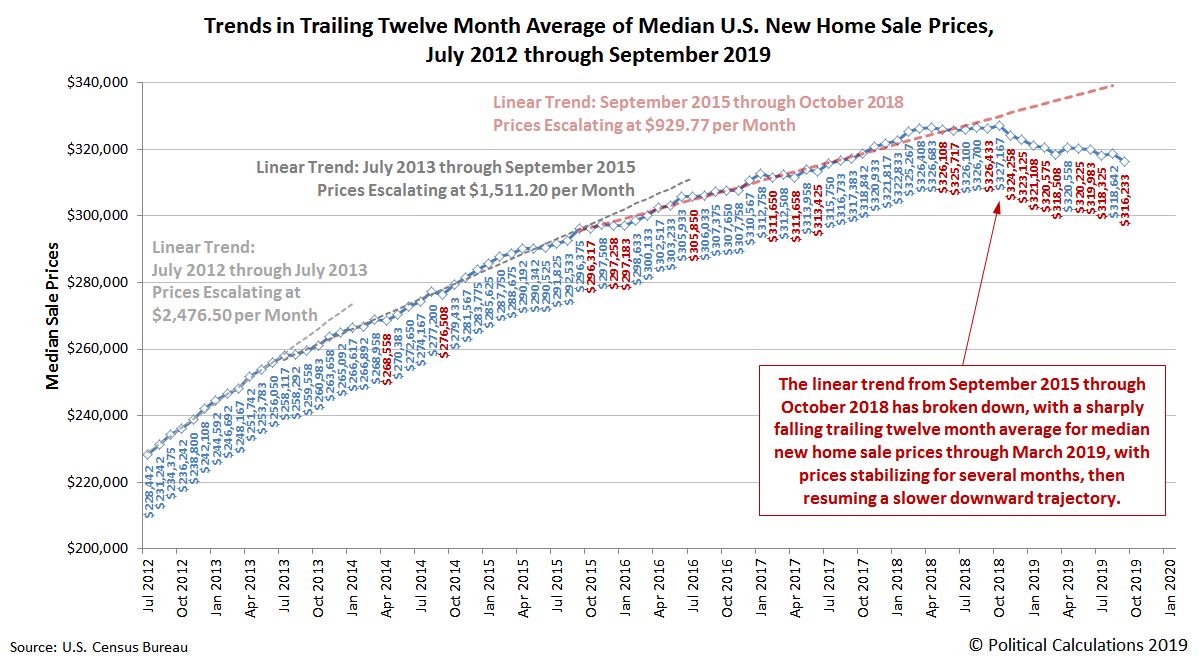
After smoothing out the month-to-month volatility in the data for median new home sale prices by calculating its rolling twelve month average, we can confirm the resumption of the falling trend that originally began in October 2018 in the following chart that focuses on the period since July 2012.
In terms of affordability, at a preliminary estimate of 4.93 times median household income for September 2019, the falling median new home sale price in the United States is now the lowest it has been since April 2013. The following chart shows the ratio of the trailing twelve month averages of median new home sale prices and median household income from 1967 to the present.
This median affordability ratio has generally only been higher during periods of time when the real estate market experienced bubble conditions, or more accurately, supply shortage conditions.
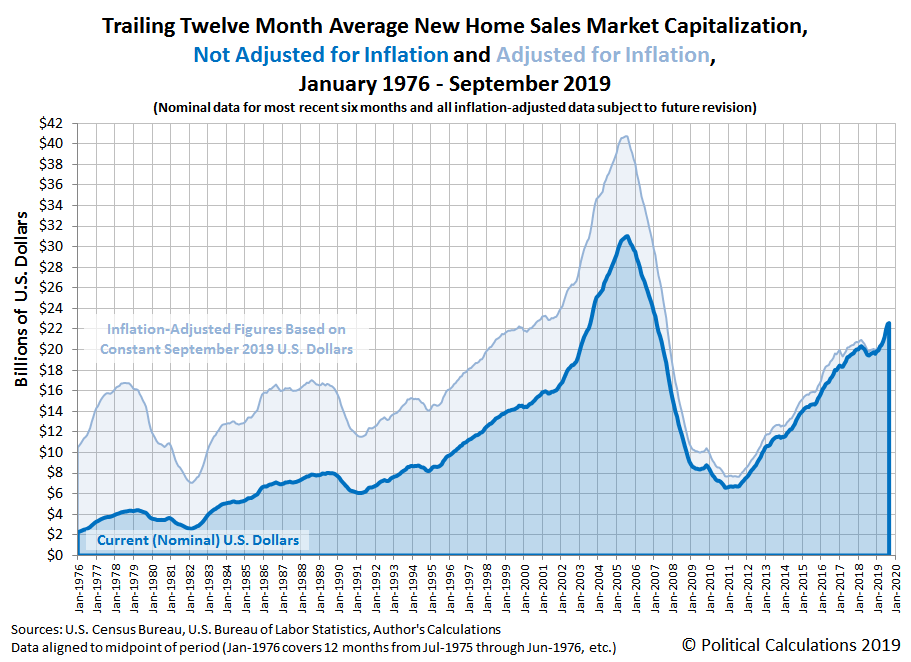
For new home builders, the falling trend for sale prices is coming as new home sales are slowing, which we can see in the slowing rise of the industry's market capitalization, the aggregate value of all new home sales across the United States.
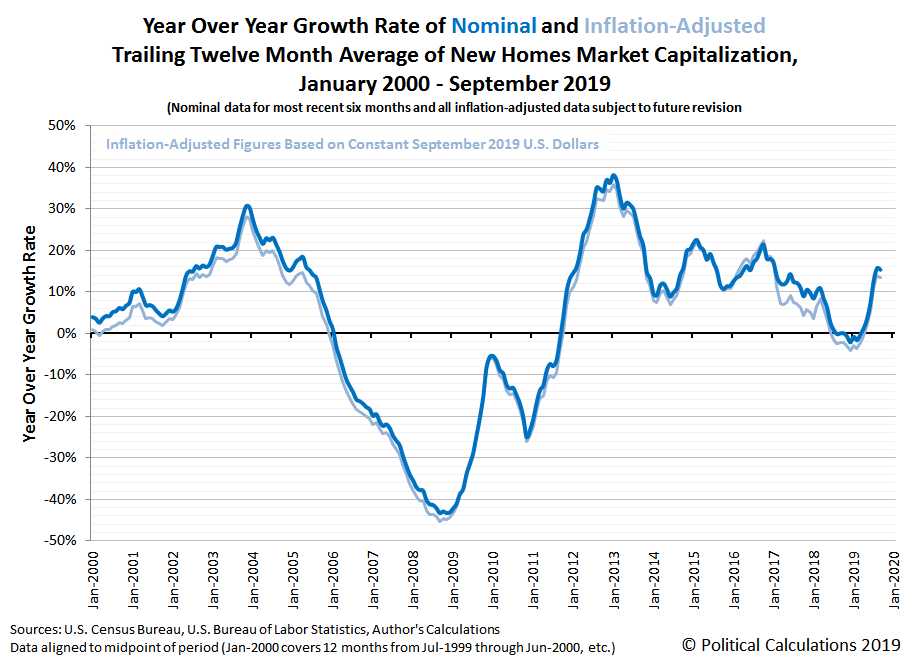
While preliminary data indicates the U.S. new home market cap is still rising, September 2019 saw the first deceleration in that growth in the months since falling mortgage rates sparked a rebound in the national new home market following its recent recessionary trough, which ran from mid-2018 to early-2019. September 2019's sudden deceleration is easier to see in the following chart showing the year over year rate of growth of the U.S. new homes market cap.
Unfortunately, the U.S. Census Bureau's new home sales data doesn't allow for the kind of state or local-level analysis we can do with existing homes data, but their available regional data points to the West region as having seen significantly falling sales in September 2019. When the state level existing homes sales data for September 2019 becomes available next month, we'll take a closer look at the West region, where we assume that whatever is happening with the trends for new homes in those states will be paralleled in the much more detailed existing homes sales data.
Labels: real estate
Welcome to the blogosphere's toolchest! Here, unlike other blogs dedicated to analyzing current events, we create easy-to-use, simple tools to do the math related to them so you can get in on the action too! If you would like to learn more about these tools, or if you would like to contribute ideas to develop for this blog, please e-mail us at:
ironman at politicalcalculations
Thanks in advance!
Closing values for previous trading day.
This site is primarily powered by:
CSS Validation
RSS Site Feed
JavaScript
The tools on this site are built using JavaScript. If you would like to learn more, one of the best free resources on the web is available at W3Schools.com.


