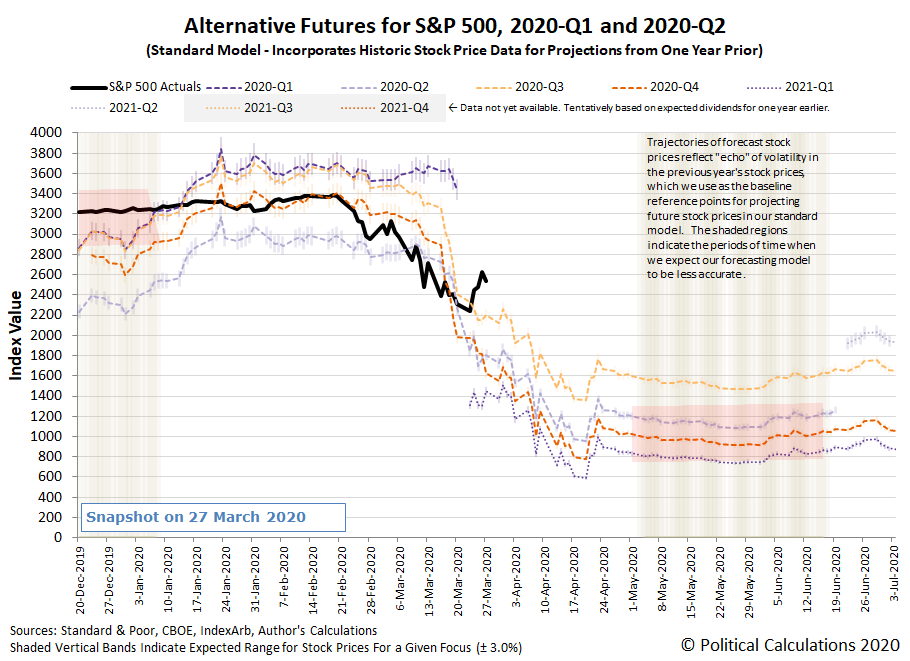
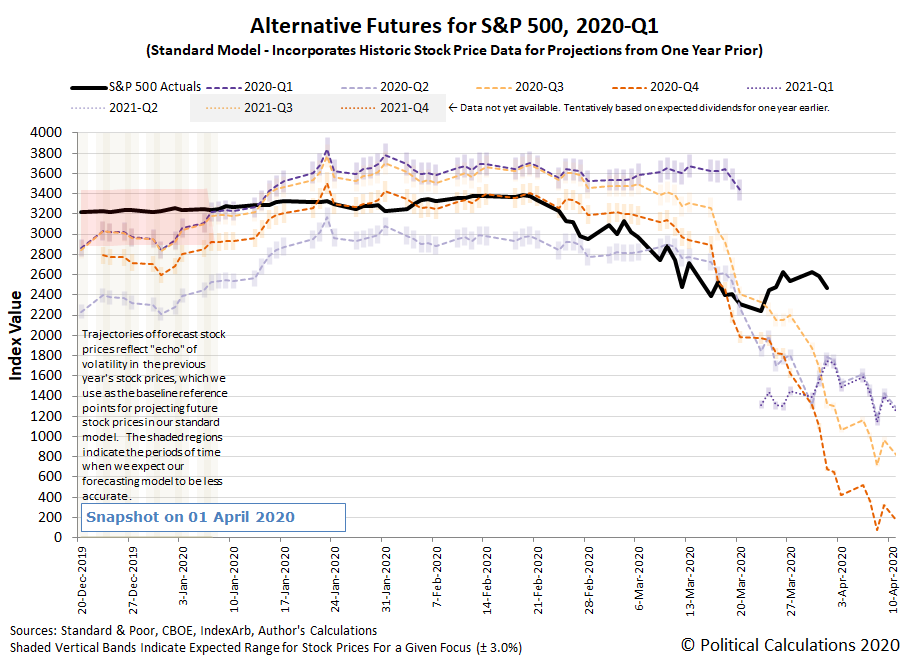
We've reached an interesting juncture for the S&P 500. Thanks to some monumental stimulus from the U.S. Federal Reserve and other global central banks, along with the promise of trillions in fiscal relief for U.S. businesses from the U.S. government, stock prices rebounded over where they closed in the previous week.
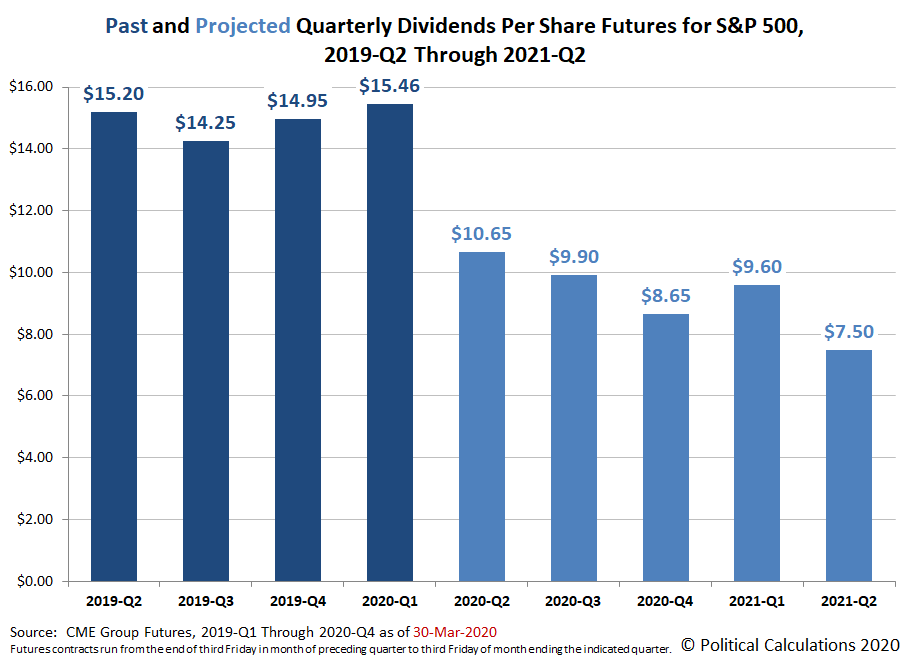
That's the good news. The bad news is both actions have come too late for U.S. firms to avoid having to cut their dividends, which saw continued deterioration over the past week. The following chart shows the level to which the expectations for future S&P 500 quarterly dividends per share deteriorated by the end of trading on Friday, 27 March 2020.
That makes the S&P 500's current level look quite a lot like a speculative bubble with respect to where the dividend futures-based model would set them based on the S&P 500's projected fundamentals.
As such, we see the S&P 500 as rising and falling based mostly on speculation, which suggests continued volatility coupled with downward momentum in the near future.
The flow of new information during the past week provides the context behind the market's various surges and retreats, where partisan politics emanating from the U.S. House of Representatives that needlessly delayed fiscal relief for American households and businesses negatively impacted by the numerous statewide economic shutdowns that were ordered during the past week to cope with the spreading coronavirus epidemic in the U.S.
- Monday, 23 March 2020
- Crude extends fall as U.S. gasoline slumps 20% amid demand fears
- Democratic party leadership's partisan games derail $1 trillion fiscal relief bill:
- Emergency Economic Rescue Plan in Limbo as Democrats Block Action
- Mnuchin urges U.S. Congress to pass $2 trillion economic relief bill
- Bigger stimulus developing all over:
- World Bank could deploy $150 billion over 15 months in coronavirus battle
- Central banks deploy record sums to break financial logjam, but may need more
- Mnuchin says G20 set to coordinate globally as needed
- 'No limits' to euro zone's coronavirus response, Eurogroup chief says
- Fed aims 'bazooka' to backstop coronavirus-hit economy
- This is a big one - the Fed is now backing commercial paper and issuing loans to corporations for the first time in its history, which will contribute toward ending an underreported run on the bank....
- With latest moves, Fed becomes creditor in chief for U.S. business
- Fed, ECB minions confirm gloomy outlook for world economy:
- ECB's de Guindos says coronavirus will put Europe into a recession
- Fed's Bullard: Coronavirus shutdown not a recession but an investment in survival
- Historic Fed boost fails to stop Wall Street's coronavirus-driven sell-off
- Tuesday, 24 March 2020
- Coronavirus impacts to major U.S. economic sectors:
- Oil little changed as falling demand offsets hopes of U.S. aid package
- U.S. new home sales fall in February, January revised up sharply
- Coronavirus crisis rocks airlines and planemakers
- Bigger trouble developing all over:
- Euro zone business activity collapses in March as coronavirus spreads: PMIs
- Shipping industry urges G20 to keep freight flowing as virus hits supply chains
- Bigger stimulus developing in Washington D.C., China, Eurozone:
- Mnuchin: Negotiators 'very close' to deal on coronavirus stimulus
- Chinese consumer finance firms rush to raise money via ABS amid coronavirus
- Germany: 750 billion euro aid package is just first step in tackling coronavirus
- Central banks restoring liquidity to cash-starved corporate debt/money markets:
- Companies rush to debt market as Fed eases funding logjam
- Fed's 'bazooka' soothes dollar funding squeeze
- Clearing the global dollar shortage: How the U.S. could intervene to weaken its surging dollar
- ECB intends to be major buyer in commercial player market, Villeroy says
- Positive speculation in absence of fiscal relief bill powers stock market upward:
- Wednesday, 25 March 2020
- Good and bad for oil industry, consumers:
- Bigger trouble developing all over:
- German economy could shrink by 5-20% this year: Ifo economist
- Coronavirus lockdowns seen hitting Europe Inc earnings heavily
- Coronavirus sweeps across New York, California fears it could be next
- Bigger stimulus developing all over. Or not:
- Senators reach deal on $2 trillion stimulus bill aimed at coronavirus, bill will pass 'later today,' says McConnell
- Tempers rise as U.S. Senate awaits vote on $2 trillion coronavirus bill
- No action in House to consider bill
- Exclusive: ECB's Lagarde asked euro zone ministers to consider one-off 'coronabonds' issue - officials
- Fed, ECB minions
- Bullard: $2 trillion package working through Congress 'scaled about right' for crisis
- Absorb shock now or face permanent destruction, Draghi warns: FT
- Stock prices
- Thursday, 26 March 2020
- Coronavirus pandemic continues roiling U.S. economy:
- U.S. braces for record surge in jobless claims amid coronavirus fallout
- Oil sheds more than $1 as weakening demand outweighs stimulus hopes
- Factbox: Trade restrictions on food exports due to coronavirus pandemic
- Bigger economic trouble developing all over:
- China's factories reopen, only to fire workers as virus shreds global trade
- Trade bellweather Singapore signals deep recession for world as virus batters economy
- Japan says virus has made economy's condition 'severe', worst view in seven years
- German economy could shrink by 10% this year due to coronavirus: IW
- Italy PM sees Europe in 'hard, severe' recession post-coronavirus
- Euro zone faces 2% recession, 10% if lockdown lasts: S&P Global
- Bigger stimulus developing all over:
- U.S. Senate passes $2 trillion bill for 'strange and evil' coronavirus crisis
- Lackadaisical leadership in the House of Representatives: Pelosi expects bipartisan House vote for $2 trillion coronavirus bill Friday
- G20 leaders to inject $5 trillion into global economy to fight coronavirus
- IMF calls meeting of steering committee on pandemic response: source
- Fed actions to revive liquidity:
- Fed balance sheet tops $5 trillion for first time as it enters coronavirus war mode
- U.S. banks borrow at discount window after Fed offers stigma relief
- Wall Street powers stocks higher on $2 trillion stimulus; dollar takes a hit
- Friday, 27 March 2020
- Global oil industry being hammered:
- Oil plunges posting fifth straight weekly loss despite stimulus efforts
- Exclusive: Russia calls for new enlarged OPEC deal to tackle oil demand collapse
- Global oil refiners shut down as coronavirus destroys demand
- Bigger trouble developing in Germany:
- Volkswagen burning through $2.2 billion a week as coronavirus halts production: CEO
- Around one in five German firms see themselves at risk of insolvency: survey
- Bigger stimulus developing all over:
- Fed minion acknowledges U.S. recession:
- Dividend cuts coming to Euro zone banks: ECB tells banks to be prudent on dividends, avoid capital hole later
- Wall Street tumbles as U.S. virus cases pass 85,000
What else happened during the week that was? Barry Ritholtz succinctly summarized the positives and negatives he found in the past week's economics and market-related news.
As for what will happen this week, if you're accessing this article on a site that republishes our RSS news feed, please be sure to check in on the original version of this article as it appears on our site for daily updates, which we'll continue until the market's volatility settles.
Stimulus Speculation Continues Powering S&P 500
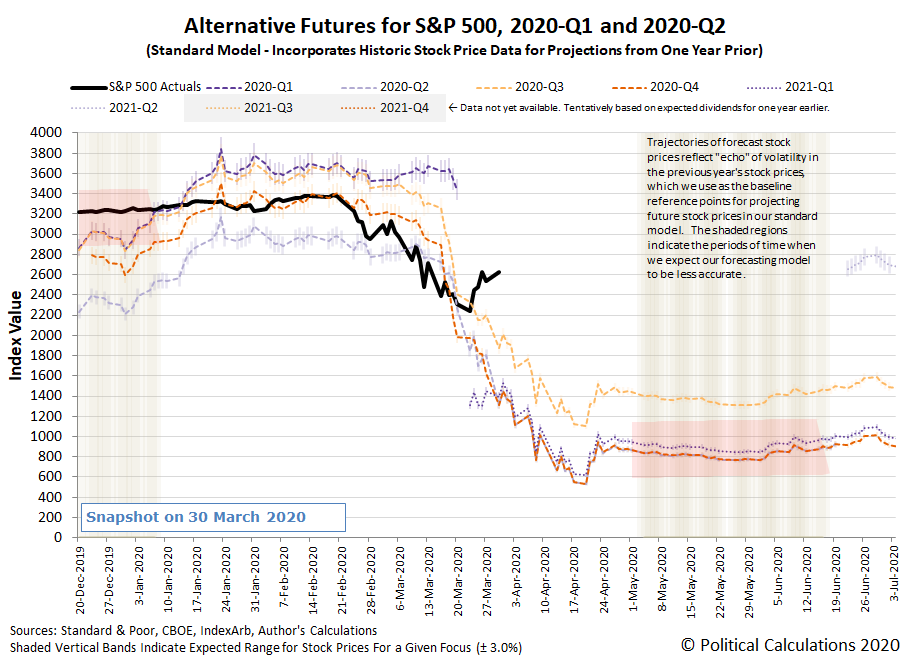
Update 30 March 2020 6:00 PM Eastern: After the U.S. took the lead in the global stimulus charge last week, Japan followed that lead at the beginning of this week in announcing an absolutely massive stimulus effort. Combined with a recognition the Fed can and will need to continue expanding its monetary stimulus efforts, which is starting to show some signs of traction, the S&P 500 powered higher in response, rising 3.35% to close at 2,626.65. Looking at the influence of last week's passage of the U.S.'s latest relief package, health care firms did particularly well on the day.
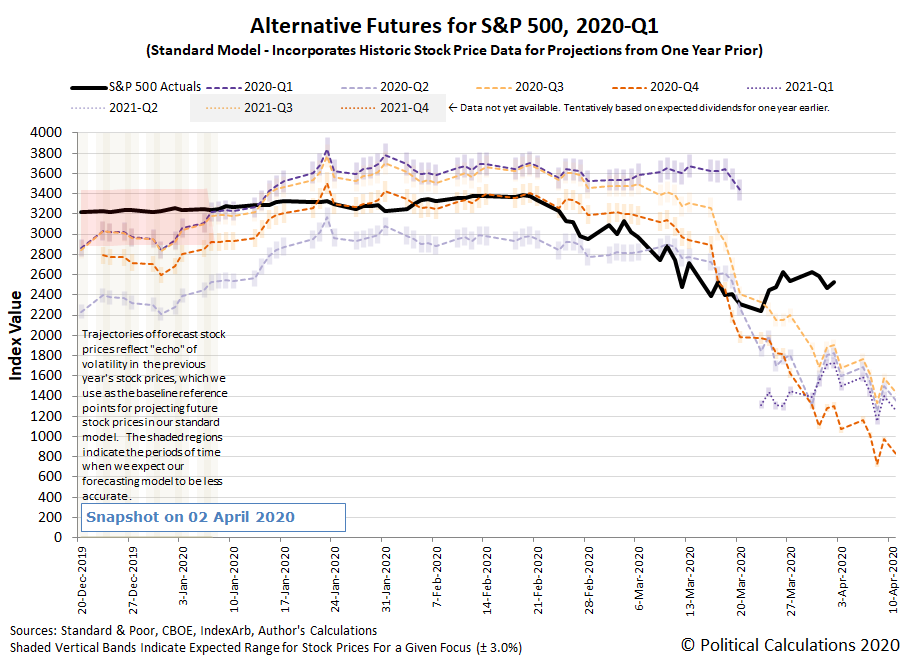
At the same time, the outlook for dividend futures deteriorated sharply for 2020-Q2, 2020-Q3, and 2020-Q4, shown on the first chart below, while the trajectory of the S&P 500 moved up while the alternative futures based on those expectations for future dividends continue to point downward, shown on the second chart below.
It is highly likely that firms receiving relief via the U.S. government's relief package signed into law last week will be suspending their dividends to preserve their cash flow, which may account for the deterioration in the expectations for future dividends. That this negative change in expectations for fundamentals was accompanied by rising stock prices perhaps suggests an unstable speculative bubble based on promises of central bank and government relief and stimulus is inflating the stock market at this time.
The Worst First Quarter Ever?
Update 31 March 2020 5:30 PM Eastern: Normally, we look to ZeroHedge to cover doom and gloom in the U.S. stock market. But today, professional market cheerleader CNBC confirmed that the first quarter of 2020 was the worst ever in the 135 year history of the Dow!
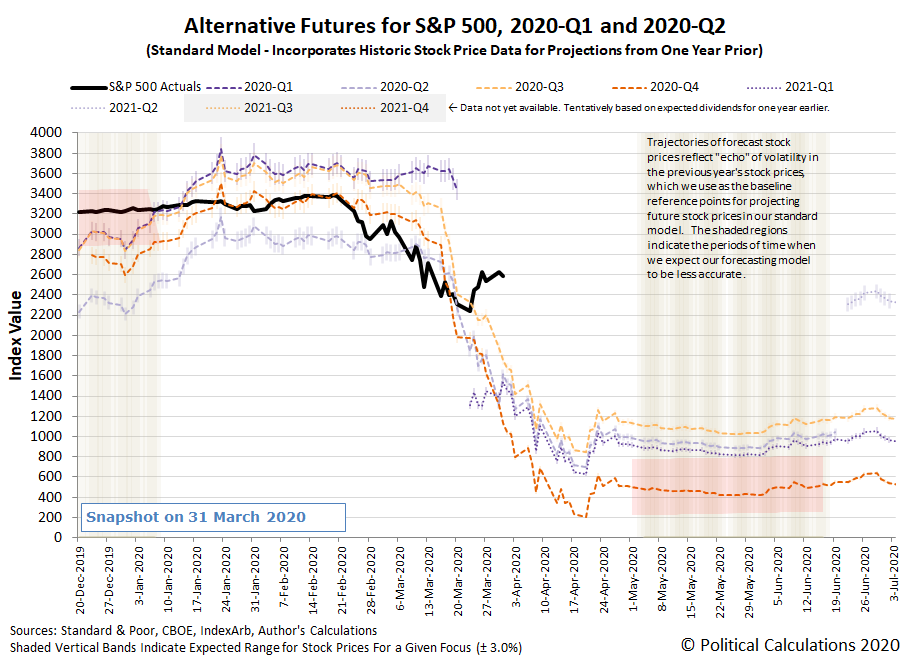
But wait, that's not the worst of what happened today. Expectations for S&P 500 dividends in 2020-Q3 and 2020-Q4 continued down their very pessimistic paths, with both continuing their trends of notable deterioration. By contrast, the S&P 500 closed down 1.6% to 2,584.59, which though down for the day, was positively bubbly compared to the thrashing that dividend futures saw.
There was an upside in that expectations for dividends in 2020-Q2 rebounded from the pessimism that drove them down yesterday, but that's a small consolation considering the decoupling we're observing between dividend futures and the S&P 500 during the current disruptive event the markets are experiencing as order is being left behind.
President Trump began pitching a $2.2 trillion infrastructure spending bill, which we think is likely contributing to the speculation sustaining the S&P 500 at the level it is. How long that might last remains to be seen, but the one thing we can say for certain is 2020-Q1 is best considered in the rear-view mirror.
Stock Prices Start Deflating from Bubbly Speculation Levels
Update 1 April 2020 5:00 PM Eastern: No April Fool's Day jokes here. Quarterly dividend futures continued to go haywire in a very thinly traded market, with expectations for 2020-Q2 rising, but apparent expectations dropping significantly for 2020-Q3 and 2020-Q4 again, before suddenly rebounding strongly in 2021-Q1. Let's just say that there looks like a pricing error in the underlying dividend futures contracts, where a futures-savvy investor may have the opportunity to figuratively pick money up off the sidewalk if they can tell in which direction the errors are being made.
Meanwhile, some of the bubbly speculation that has been fueling the S&P 500 appears to have deflated, with the index falling 4.41% to close at 2,470.50.
We'll be depressing everyone tomorrow with a report on dividend cuts in March 2020 and in 2020-Q1.
Trump-Negotiated Truce in Saudi-Russian Oil Price War Boosts S&P 500
Update 2 April 2020 6:30 PM Eastern: President Trump's apparent negotiated truce in Saudi Arabia's and Russia's oil price war boosted the S&P 500, despite the news that over 6 million Americans had filed for unemployment as a result of all the state and local government-ordered business closures and stay-at-home orders that have been imposed to combat the spread of the coronavirus epidemic in the U.S. The S&P 500 closed up 2.28% to close the day at 2,526.90.
At the same time, some sense of sanity looks to have returned to the dividend futures market, which saw boosts across the board, thanks to the Trump-negotiated deal's effect on the future outlook for oil and gas company dividends.
We're also wondering if we need to revisit the empirically-determined 'constant' amplification factor we have typically used in our dividend futures-based model. It occurs to us that the market has experienced a regime change with the introduction of such a massive amount of stimulus since 23 March 2020, both fiscal and monetary, where the amplification factor constant that we have been using for the past 10+ years may no longer consistent with how investors are currently valuing stock prices.
We've been playing with that idea behind the scenes, where if say the amplification factor constant has shrunk from 5 to 2, the outlook for stock prices would be better than what the alternative futures chart above indicates. Then again, the amplification factor is how the model absorbs the effect of speculative noise, so that possibility would also still exist.
Either way, the change may only be temporary, so it's just another thing to watch. Regardless, the near term trend for stock prices would be downward.
Welcome to the blogosphere's toolchest! Here, unlike other blogs dedicated to analyzing current events, we create easy-to-use, simple tools to do the math related to them so you can get in on the action too! If you would like to learn more about these tools, or if you would like to contribute ideas to develop for this blog, please e-mail us at:
ironman at politicalcalculations
Thanks in advance!
Closing values for previous trading day.
This site is primarily powered by:
CSS Validation
RSS Site Feed
JavaScript
The tools on this site are built using JavaScript. If you would like to learn more, one of the best free resources on the web is available at W3Schools.com.

