In 1956, Standard & Poor created a new stock market index. Composed of the top 500 (or so) individual company stocks in the U.S. stock market and weighted according to their market capitalization within the index, the index itself has become the standard gauge of the larger U.S. stock market. 2021 marks the 65th year the S&P 500 daily stock market index has been in existence.
But the index has a deeper history. In 1928, Standard Statistics Bureau, one of the pre-merger companies that later became today's Standard & Poor, created a daily composite stock market index made up of 90 individual stocks of U.S. corporations, with historical data going back to 1925 to provide some built-in history for the new index. The combination of 50 industrials, 20 railroads, and 20 utility companies provided one of the first broad measures of the U.S. stock market, expanding beyond the 30 industrial firms covered by the Dow Jones Industrial Average. Around the same time, Standard also created a weekly index to track the collective stock market performance of 500 U.S. companies, which is eventually what took over in 1956 as a daily index.
Of course, these companies didn't suddenly materialize into existence in 1928. Many of these firms have stock price data that extends back much earlier. In 1938, the Cowles Commission for Research in Economics worked out their equivalent market index performance going back to 1871, which means we really have 150 years worth of data for the U.S. stock market. Before 1871, the stock price data for publicly traded companies becomes too sparse to track, which is why the historical data only goes back this far.
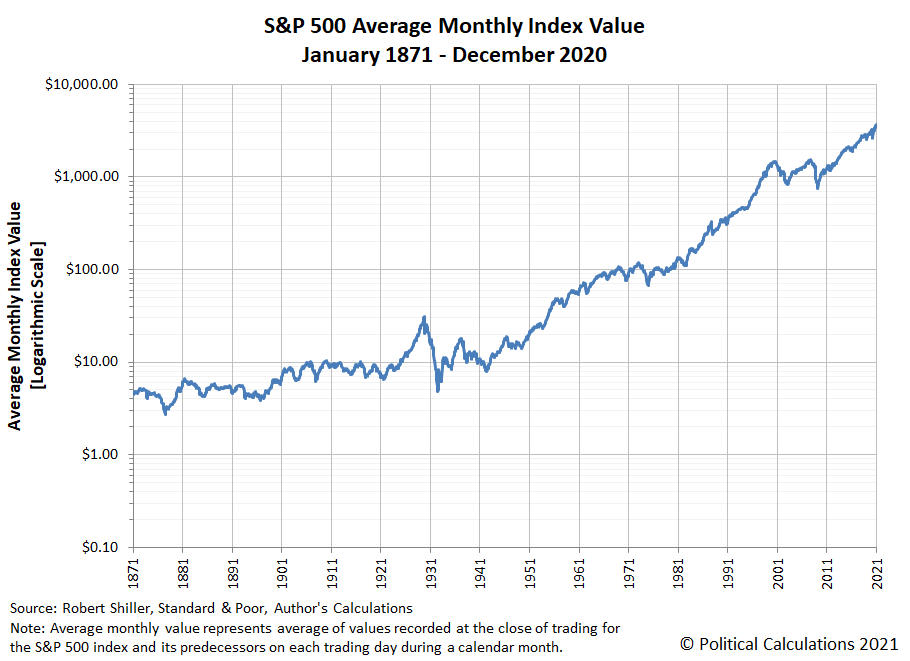
We thought we'd mark the sesquicentennial for U.S. stock market data with the following charts, showing the average monthly index value, the trailing year dividends per share and trailing year earnings per share for the S&P 500 and its predecessor indices from January 1871 through December 2020. Please click the images to access full size versions of the charts.
Thanks to exponential growth, the data on these charts look something like hockey sticks, so we generated the following charts to show the same data on a logarithmic scale.
If you'd like to get the data for any point of time shown on these charts, we have dedicated tools that can accommodate you. The links below will take you to the historical data we make freely available.
- The S&P 500 at Your Fingertips
Our signature tool providing access to the whole history of the S&P 500's average monthly prices, trailing year dividends and earnings per share! As a bonus, it also calculates the rate of return that would have been realized between any two calendar months, with and without the reinvestment of dividends, and also with and without the effect of inflation.
- Investing Through Time
If you invested $1,000 in the S&P 500 in June 2009, roughly how much would it have been worth ten years later? What if you invested $100 in the S&P 500 in each month from February 2006 through December 2020 - how much would that portfolio be worth today? Our Investing Through Time tool can help you answer questions like these!
- Cashing Out of the S&P 500
It's one thing to build up a nest egg, it's another thing to make it last for as long as you might need it! This tool puts the history of the S&P 500 to use to see how your investment withdrawal strategy would have fared through some of the best and worst eras for the U.S. stock market.
- Quarterly Data for the S&P 500, Since 1871
This is the only tool you'll find anywhere for indicating the quarterly earnings and dividends per share that would have actually been reported for the S&P 500 (and its predecessor indices and components), going all the way back to the first quarter of 1871....
Image credit: Photo by Sophie Backes on Unsplash
Labels: data visualization, SP 500, stock market
Welcome to the blogosphere's toolchest! Here, unlike other blogs dedicated to analyzing current events, we create easy-to-use, simple tools to do the math related to them so you can get in on the action too! If you would like to learn more about these tools, or if you would like to contribute ideas to develop for this blog, please e-mail us at:
ironman at politicalcalculations
Thanks in advance!
Closing values for previous trading day.
This site is primarily powered by:
CSS Validation
RSS Site Feed
JavaScript
The tools on this site are built using JavaScript. If you would like to learn more, one of the best free resources on the web is available at W3Schools.com.


