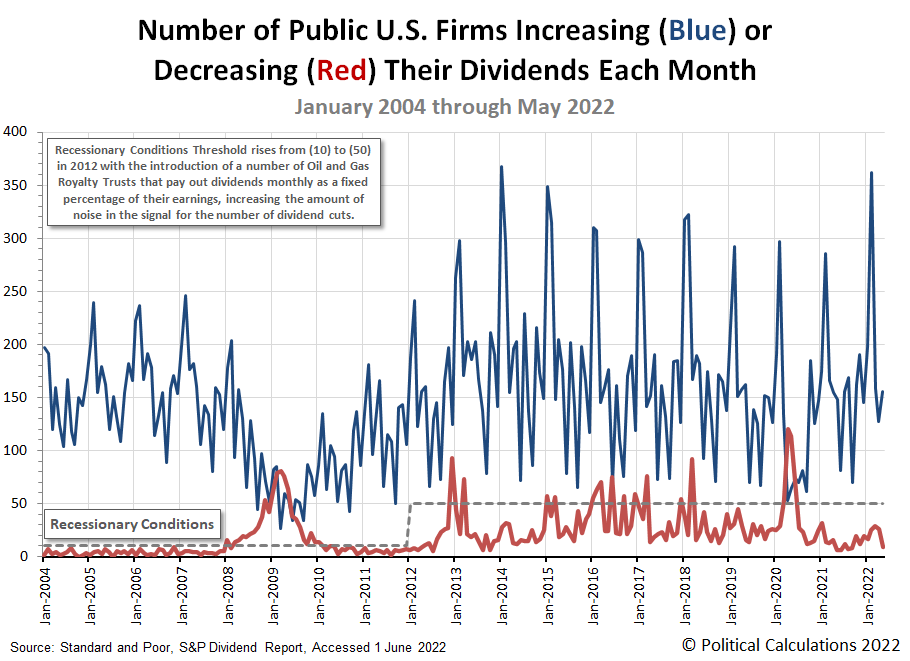
Dividend paying firms in the U.S. showed unexpected strength in May 2022. More dividend-paying firms either increased their dividends or paid extra dividends than in previous months, while fewer firms announced dividend cuts. It's the kind of combination that typically produces good outcomes for the owners of dividend-paying stocks.
Here's May 2022's dividend metadata for the U.S. stock market:
- 4,041 firms declared dividends during May 2022, a decrease of 453 over April 2022's count and 2,188 more than did a year earlier in May 2021.
- May 2022 also recorded 85 firms that announced special (or extra) dividend. That's 32 more than in April 2022 and 38 more than in May 2021.
- There were 156 companies that announced dividend rises during the month, an increase of 29 above April 2022's figure and 8 more than May 2021.
- The number of companies announcing dividend cuts dropped to 9 in May 2022, 17 fewer than April 2022's total, but 3 more than May 2021's recorded value.
- For the eleventh consecutive month, zero firms omitted paying dividends.
Overall, these figures suggest May 2022 saw a reversal of a trend that has been a developing cause for concern in recent months. But the question remains of whether that marks the start of a new trend or if it's the calm before the storm.
Regardless, here's the latest update for our chart tracking the U.S. stock market's monthly number of dividend increases and decreases since January 2004.
Here's the short list of firms that announced dividend cuts in May 2022:
- Ellington Residential Mortgage (REIT-Mortgage) (NYSE: EARN)
- Oasis Petroleum (NASDAQ: OAS)
- Sisecam Resources (NYSE: SIRE)
- CVR Partners (NYSE: UAN)
- Sabine Royalty Trust (NYSE: SBR)
- Eagle Bulk Shipping (NASDAQ: EGLE)
- Sculptor Capital Management (NYSE: SCU)
- National CineMedia (NYSE: NCMI)
- United-Guardian (NASDAQ: UG)
We can't help but notice there's a distinct lack of firms from the oil and gas industrial sector compared to previous months. Since many of these firms pay variable dividends that automatically rise and fall with their earnings, which in turn are greatly affected by oil and gas price trends, their absence points to a relatively good period for this sector of the U.S. economy. We'll see soon enough how long that situation might continue.
Reference
Standard and Poor. S&P Market Attributes Web File. [Excel Spreadsheet]. Accessed 1 June 2022.
Labels: dividends
Welcome to the blogosphere's toolchest! Here, unlike other blogs dedicated to analyzing current events, we create easy-to-use, simple tools to do the math related to them so you can get in on the action too! If you would like to learn more about these tools, or if you would like to contribute ideas to develop for this blog, please e-mail us at:
ironman at politicalcalculations
Thanks in advance!
Closing values for previous trading day.
This site is primarily powered by:
CSS Validation
RSS Site Feed
JavaScript
The tools on this site are built using JavaScript. If you would like to learn more, one of the best free resources on the web is available at W3Schools.com.
