Imagine you were out to buy a typical new home home back in March 2021. The median price of a new home sold in the U.S. that month was $359,600. The average 30-year conventional mortgage rate back then was 3.083%.
Flash forward two years later, to March 2023, and a new home buyer in the U.S. would pay a median price of $449,800 for a new home according to initial estimates. And the interest rate on their 30-year conventional mortgage would be about 6.544%. How different would the monthly mortgage payment be for someone buying the median new home sold in March 2023 compared to what someone would have paid for the median new home sold two years earlier?
There's a little more to it than that, because we also need to take things like property taxes and homeowners insurance into account. We would also need to factor in how big the median down payment for a home is these days, and if that's less than 20% of the sale price of the new home, how much private mortgage insurance would add to its monthly payment.
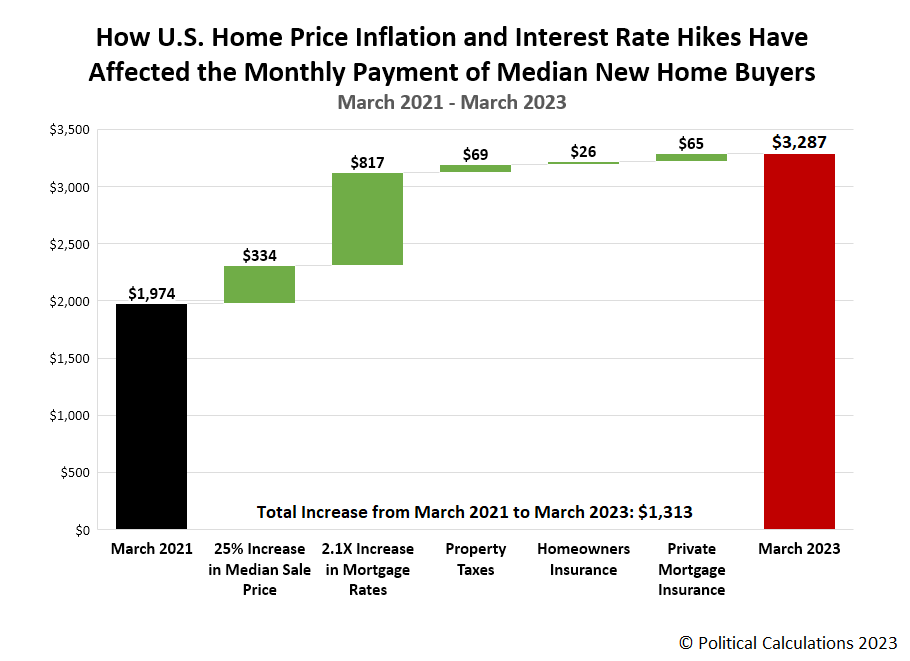
So we did all that and created the following chart to show how different the monthly payment is for a median new home sold in March 2023 is from that for the median new home sold back in March 2021.
Overall, we find that between the increase in the median price of new homes sold in the U.S. and interest rate hikes, the monthly payment for the buyers of median new homes has increased by $1,313, rising 66.5% from $1,974 in March 2021 to $3,287 in March 2023.
Of that monthly increase, $334 is because of the inflation of new home sale prices, which is how much higher a basic mortgage payment would be if interest rates had not also risen. Of course, a higher home value would also boost the amount of property taxes owed by $69 per month and the amount of homeowners insurance by $26 per month.
That doesn't include the stand-alone increase in the size of a down payment, which for 2022's median of 13% of the sale price of a home, would have risen by $11,276, increasing from $46,748 to $58,474.
Because the median down payment for a home in 2022 was 13%, the cost of private mortgage insurance would also be tacked onto the monthly payment. While that can range anywhere from 0.19% and 1.86% of the balance owed on a mortgage, we set it at 1.0% for our brand new homeowner to put it in the middle of that range.
Briefly going back to property taxes, the estimates we used in our calculations is based on the median statewide property tax rate of 0.92%, which just happens to be the rate that applies in the state of Georgia. We did not factor in any county, municipal, or local property taxes.
The remaining $817 of the monthly payment increase is entirely due to the rise of average mortgage interest rates between March 2021 and March 2023. With the 30-year mortgage rate more than doubling during this period, this factor represents the biggest contributor to the increase in the monthly cost of owning a new home. It's all the more remarkable because nearly all of the increase in mortgage rates took place after December 2021.
Finally, we were inspired to create this waterfall chart by u/CheeryOaf's original version at r/dataisbeautiful. It's a neat way to capture how the various components of the monthly cost of homeownership have changed.
Image credit: Photo by Tierra Mallorca on Unsplash.
Labels: data visualization, personal finance, real estate
Welcome to the blogosphere's toolchest! Here, unlike other blogs dedicated to analyzing current events, we create easy-to-use, simple tools to do the math related to them so you can get in on the action too! If you would like to learn more about these tools, or if you would like to contribute ideas to develop for this blog, please e-mail us at:
ironman at politicalcalculations
Thanks in advance!
Closing values for previous trading day.
This site is primarily powered by:
CSS Validation
RSS Site Feed
JavaScript
The tools on this site are built using JavaScript. If you would like to learn more, one of the best free resources on the web is available at W3Schools.com.

