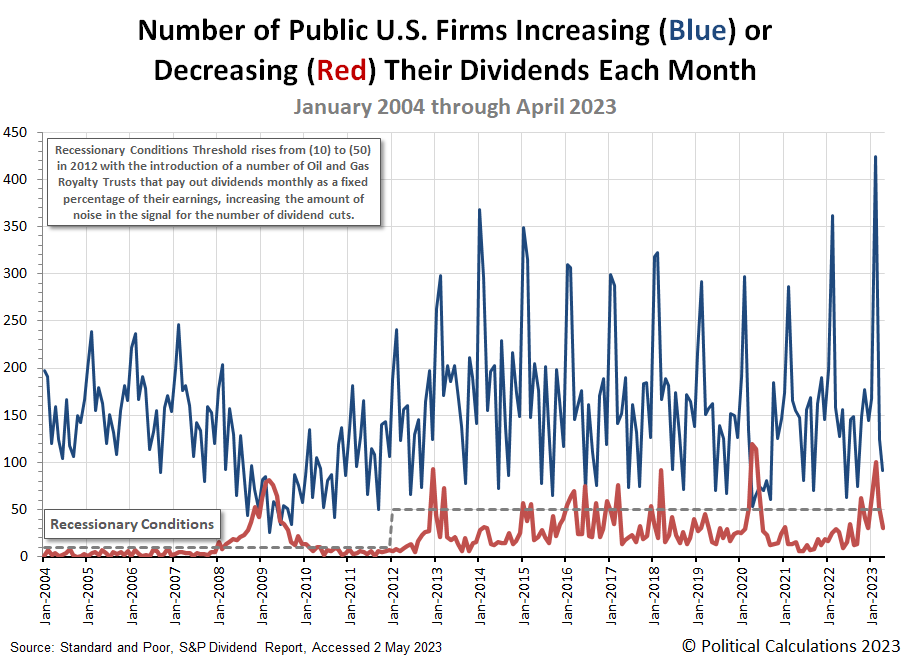
Signs of distress continued to build in the U.S. stock market in April 2023. The number of firms increasing their dividends fell substantially during the month. Meanwhile, the number of firms reducing dividend payments to their shareholding owners also fell, though much of that seemingly positive development is attributable to things not getting much worse for one particular industry that's been absolutely slammed in recent months.
We'll get to that seemingly positive story when we get deeper into the month's unfavorable dividend actions. The bigger story in April 2023 is what happened with the number of firms announcing dividend increases.
To put this developing story into context, February 2023 set a new monthly record for this measure when 424 firms declared they would increase their dividend payouts. Two months later, the number of dividend paying companies in the U.S. stock market fell to 91.
That 78% drop represents the third-largest percentage decline of firms announcing dividend rises recorded over a two month period in U.S. stock market history. The second-largest event is the collapse in dividend increases that accompanied the arrival of the coronavirus pandemic recession, when the number of dividend rises announced plunged by 82% between February and April 2020. The only event worse than both these in percentage terms for dividend rises over two months was the 100% decline that took place between June and August 1932 as the U.S. stock market bottomed during the Great Depression.
Snapping back to the modern era, the following chart shows the number of firms either increasing their dividends each month (blue) or decreasing them (red).
To help flesh out the overall signal being sent by dividend-paying firms in the U.S. stock market, the following table presents their dividend metadata for April 2023. It shows both favorable and unfavorable dividend changes are notably down substantially, both in Month-over-Month (MoM) and Year-Over-Year (YoY) terms:
| Dividend Changes in April 2023 | |||||
|---|---|---|---|---|---|
| Apr-2023 | Mar-2023 | MoM | Apr-2022 | YoY | |
| Total Declarations | 3,169 | 4,654 | -1,485 ↓ | 3,588 | -419 ↓ |
| Favorable | 130 | 173 | -43 ↓ | 186 | -56 ↓ |
| - Increases | 91 | 124 | -33 ↓ | 127 | -36 ↓ |
| - Special/Extra | 39 | 44 | -5 ↓ | 53 | -14 ↓ |
| - Resumed | 0 | 5 | -5 ↓ | 6 | -6 ↓ |
| Unfavorable | 30 | 53 | -23 ↓ | 26 | 4 ↑ |
| - Decreases | 30 | 53 | -23 ↓ | 26 | 4 ↑ |
| - Omitted/Passed | 0 | 0 | 0 ↔ | 0 | 0 ↔ |
Our monthly sampling of dividend changes captured 14 of the reported 30 unfavorable actions. In falling back from their elevated levels of recent months, the most notable change was the absence of variable and hybrid dividend payers in the oil and gas industry. That's because crude oil prices have largely stabilized in a range between $70 and $80 per barrel in 2023 following their ~35% plunge from June through December 2022. In April 2023, we counted six firms from this industrial sector.
That number was matched by firms whose businesses are sensitive to rising interest rates, including two banks, two financial services firms, and two office-REITs (Real Estate Investment Trusts). The remaining two firms in our sampling include a mining firm and a utility company. Here's the list:
- MV Oil Trust (NYSE: MVO)
- Office Properties Income Trust (REIT-Office) (NASDAQ: OPI)
- Global Partners (NYSE: GLP)
- San Juan Basin Royalty Trust (NYSE: SJT)
- Hugoton Royalty Trust (OTC: HGTXU)
- PermRock Royalty Trust (NYSE: PRT)
- Via Renewables* (NASDAQ: VIA)
- Blackstone Group (NYSE: BX)
- HomeStreet (NASDAQ: HMST)
- Pioneer Natural Resources (NYSE: PXD)
- Vornado Realty Trust (REIT-Office)* (NYSE: VNO)
- AllianceBernstein (NYSE: AB)
- Arch Coal (NYSE: ARCH)
- First Foundation (NASDAQ: FFWM)
The two firms marked with an asterisk (*) in this listing, Via Renewables and Vornado Realty Trust, suspended (or omitted) their dividends during April 2023. That's notable mainly because we believe Standard and Poor is including these firms' actions in their monthly count of dividend decreases, which would account for why they recorded zero dividend omissions during the month. Decreases and omissions are both considered unfavorable changes for investors who own stock in dividend paying firms.
References
Standard and Poor. S&P Market Attributes Web File. [Excel Spreadsheet]. 2 May 2023.
Image credit: Photo by anvesh baru on Unsplash.
Labels: dividends, stock market
Welcome to the blogosphere's toolchest! Here, unlike other blogs dedicated to analyzing current events, we create easy-to-use, simple tools to do the math related to them so you can get in on the action too! If you would like to learn more about these tools, or if you would like to contribute ideas to develop for this blog, please e-mail us at:
ironman at politicalcalculations
Thanks in advance!
Closing values for previous trading day.
This site is primarily powered by:
CSS Validation
RSS Site Feed
JavaScript
The tools on this site are built using JavaScript. If you would like to learn more, one of the best free resources on the web is available at W3Schools.com.

