Not long ago, we looked at how inflation and interest rates changed the mortgage payment for the median new home sold in the United States in the two years between March 2021 and March 2023. As part of that exercise, we tracked down what the median down payment is for homes purchased in the U.S., which was given as 13 percent of the sale price of all homes sold in 2022. For the median new home sold in March 2023, that would be $58,474.
That raised a question. Who has that kind of cash laying around?
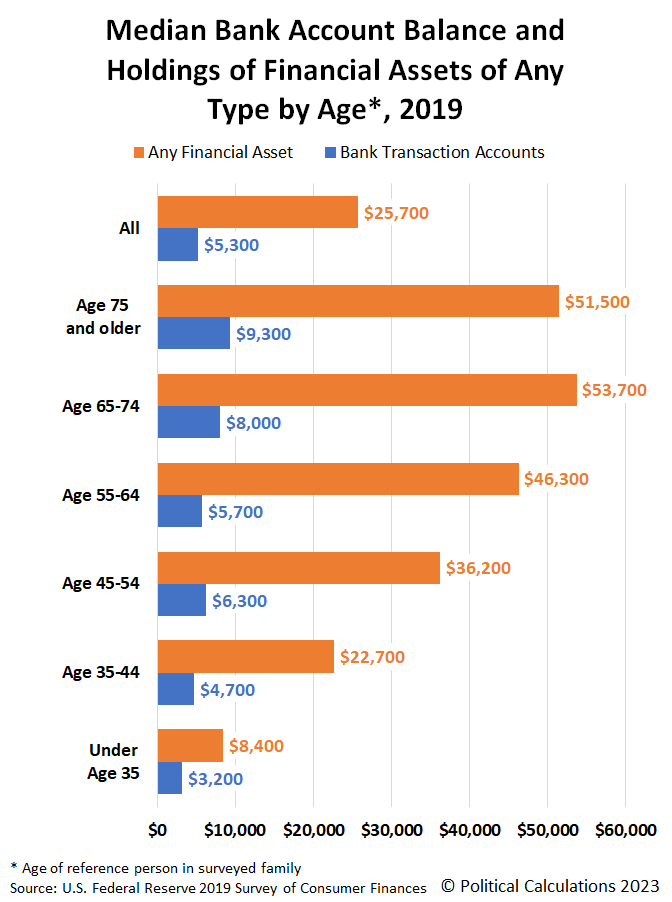
To answer the question, we tapped the Federal Reserve's 2019 Survey of Consumer Finances, which reports the median amount of assets held in bank transaction accounts, which includes savings, checking, and money market accounts among others by age group. It also tells us the median amount of financial assets of any type held by age group. The following chart shows that data:
What we find from this median data is that it's unlikely any family at or below the 50th percentile is ponying up the down payment for the median new home sold in the U.S.
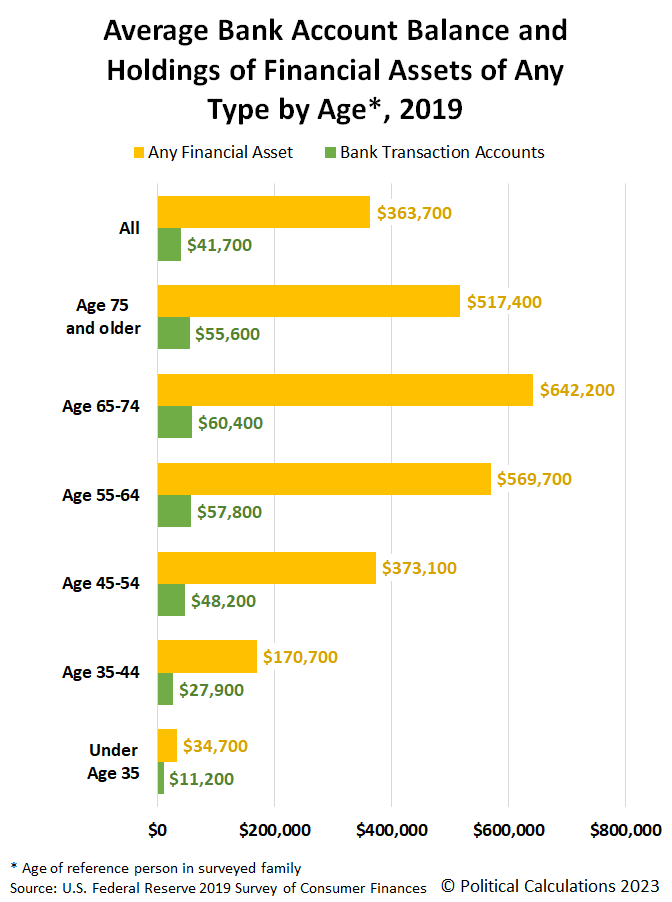
Instead, it's much more likely the family buying median new home is closer to the average when it comes to having the financial assets needed to purchase the median new home sold in the U.S. The next chart shows the mean amount of assets held in bank transaction accounts and in any financial assets by age group.
These charts represent data that was collected during 2019. The Federal Reserve will release the data it collected during 2022 later this year, sometime in September 2023.
Analyst's Notes
Financial assets of any type start with bank transaction accounts and adds relatively liquid assets in the total, including as certificates of deposit, savings bonds, bonds, stocks, money in pooled investment funds, retirement accounts, the cash value of life insurance, and other similarly liquid assets.
According to the 2019 Survey of Consumer Finances, the median family income in 2019's survey was $58,600, while the average family income was $106,500. Both the SCF's estimates are less than the U.S. Census Bureau's estimates for total money income received by families in 2019, which were $86,011 and $116,735 respectively.
References
Board of Governors of the Federal Reserve System. 2019 Survey of Consumer Finances. Table 6. Family holdings of financial assets, by selected characteristics of families and type of asset. [Excel Spreadsheet]. September 2020.
Labels: data visualization, demographics
Welcome to the blogosphere's toolchest! Here, unlike other blogs dedicated to analyzing current events, we create easy-to-use, simple tools to do the math related to them so you can get in on the action too! If you would like to learn more about these tools, or if you would like to contribute ideas to develop for this blog, please e-mail us at:
ironman at politicalcalculations
Thanks in advance!
Closing values for previous trading day.
This site is primarily powered by:
CSS Validation
RSS Site Feed
JavaScript
The tools on this site are built using JavaScript. If you would like to learn more, one of the best free resources on the web is available at W3Schools.com.


