The U.S. new home market expanded in April 2023. The market capitalization of new homes sold in the U.S. built rose during the month, with a surge in the number of new homes sold offsetting a decline in their prices.
The initial estimate of 683,000 new homes sold during April 2023 represents the highest level of this seasonally-adjusted annual rate recorded since March 2022. That month marked the beginning of the Federal Reserve's series of interest rate hikes, which has coincided with an increase in mortgage rates that have negatively affected the affordability of new homes. The time-shifed trailing twelve month average of new homes sold rose to 638,000 on an annualized basis.
Meanwhile, the average sale price of new homes sold in the U.S. declined to $501,000, with the time-shifted trailing twelve month average dipping below $527,500.
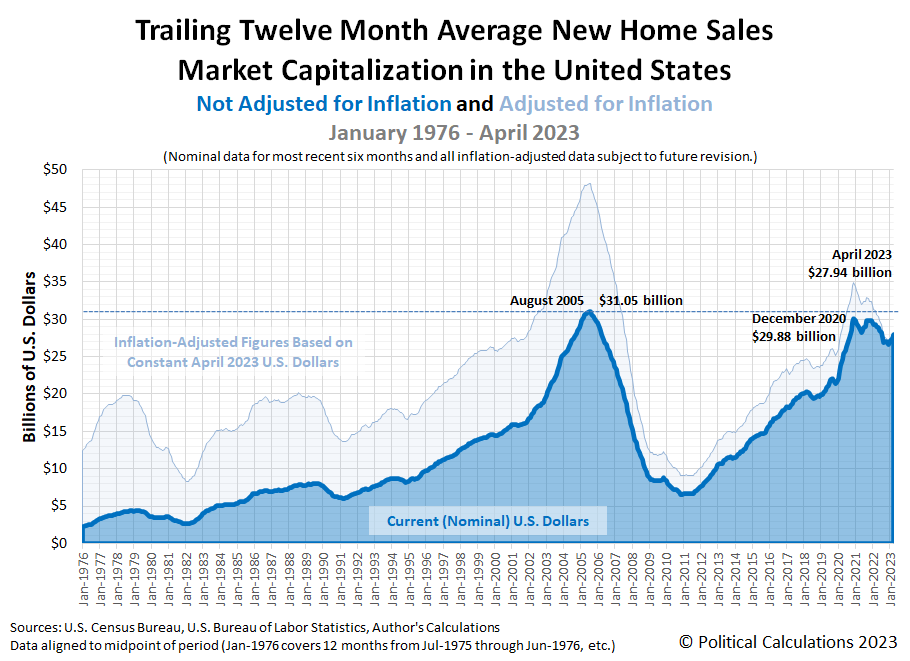
Here is the latest update to our chart tracking market capitalization of new homes sold in the U.S., which shows the improving situation for U.S. new home builders:
The chart reveals the time-shifted twelve month average of the U.S. new home market capitalization for April 2023 is $27.94 billion. This figure is an initial estimate, which will be subject to revision during each of the next three months.
The next two charts show the latest changes in the trends for new home sales and prices:
Here's how Reuters reported the continued recovery for the U.S. new home market in April 2023:
Sales of new U.S. single-family homes jumped to a 13-month high in April, boosted by a persistent shortage of previously owned houses on the market and a sharp decline in prices from last year's lofty levels....
"The evidence continues to accumulate that the housing market may have largely adjusted to the higher level of mortgage rates but the decline in the median home price is consistent with the hypothesis that home builders may be tailoring the construction of new homes towards first-time buyers," said Conrad DeQuadros, senior economic advisor at Brean Capital in New York.
New home sales increased 4.1% to a seasonally adjusted annual rate of 683,000 units last month, the highest level since March 2022. March's sales pace was revised lower to 656,000 units from the previously reported 683,000.
Coming out of the first quarter, we were uncertain how strongly the positive momentum in the new home market might continue. The lack of supply of existing homes coming onto the market was a wild card factor we couldn't anticipate, but which is proving to be a positive. It's a welcome development in that the new home market directly boosts Gross Domestic Product. New residential investment, which includes new homes, typically accounts for about 3% to 5% of the nation's GDP.
References
U.S. Census Bureau. New Residential Sales Historical Data. Houses Sold. [Excel Spreadsheet]. Accessed 23 May 2023.
U.S. Census Bureau. New Residential Sales Historical Data. Median and Average Sale Price of Houses Sold. [Excel Spreadsheet]. Accessed 23 May 2023.
Image credit: WikiMedia Commons: Wood-framed House by Jaksmata. Creative Commons Attribution-Share Alike 3.0 Unported License.
Labels: real estate
Welcome to the blogosphere's toolchest! Here, unlike other blogs dedicated to analyzing current events, we create easy-to-use, simple tools to do the math related to them so you can get in on the action too! If you would like to learn more about these tools, or if you would like to contribute ideas to develop for this blog, please e-mail us at:
ironman at politicalcalculations
Thanks in advance!
Closing values for previous trading day.
This site is primarily powered by:
CSS Validation
RSS Site Feed
JavaScript
The tools on this site are built using JavaScript. If you would like to learn more, one of the best free resources on the web is available at W3Schools.com.


