The rising trend for new home sales continued in May 2023. The initial estimate of the market capitalization of new homes sold during the month is $29.44 billion. That's a 2.6% increase over the revised estimate of $28.68 billion in April 2023, which itself was increased from an initial estimate of $27.94 billion.
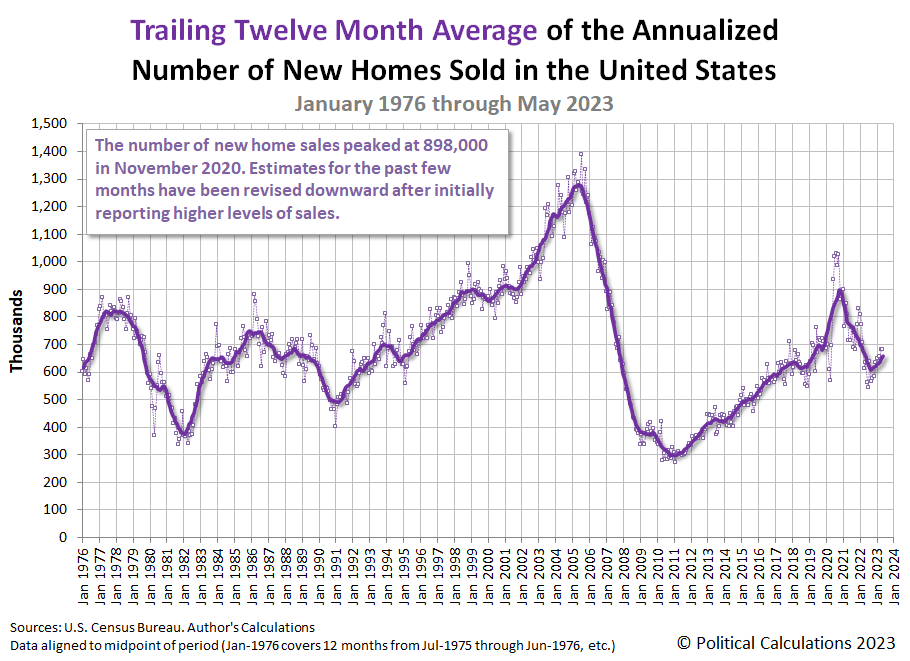
Much of that increase was driven by a sharp increase in the number of new home sales. They rose to an annualized, seasonally-adjusted initial estimate of 763,000 during May 2023 from a revised estimate of 680,000 in April 2023. We'll focus on the reasons for that 12.2% increase later in this analysis.
The initial estimate of the median price of a new home sold in the U.S. during May 2023 is $438,200, while the first indication of the average sale price was $498,000. The average price is up by a small margin from April 2023's revised estimate of $479,900, which was revised downward from an initial estimate of $501,000. Looking at the trailing 12 month average, the average sale price declined to $522,900, continuing a downward trend since December 2022.
Here is the latest update to our chart illustrating the market capitalization of the U.S. new home market:
The following two charts show the latest changes in the trends for new home sales and prices:
Reuters reports on the rising trend for new home sales:
Sales of new U.S. single-family homes surged to the highest level in nearly 1-1/2 years in May, benefiting from a dearth of previously owned homes available for sale.
New home sales jumped 12.2% to a seasonally adjusted annual rate of 763,000 units last month, the highest level since February 2022, the Commerce Department said on Tuesday....
The median new house price in May was $416,300, a 7.6% drop from a year ago. There were 428,000 new homes on the market at the end of last month, down from 432,000 in April. At May's sales pace it would take 6.7 months to clear the supply of houses on the market, down from 7.6 months in April.
Did you catch the part about the "dearth of previously owned homes available for sale"? Here's how TheRealDeal, which specializes in covering the real estate industry, reports what's happening in that portion of the U.S. real estate market:
As mortgage rates remain above early pandemic levels and housing inventory wanes, existing home sales are seeing a large drop.
Existing home sales fell 20.4 percent year-over-year in May, according to a report from the National Association of Realtors. The factors roiling the market also took a bite out of prices for existing homes, which notched its biggest annual decline in 11 years.
Despite the significant annual drop, sales from the previous month marked a small increase. On a seasonally adjusted basis, existing home sales rose by 0.2 percent from April to May.
Inventory is one of the biggest factors plaguing existing home sales. Total housing inventory was down 6.1 percent year-over-year last month. Unsold housing inventory ended May with a three-month supply available.
Because of the lack of supply of existing homes for sale in the current environment, home buyers are being forced into the market for new homes. The number of existing home sales has dropped to levels last seen during 2020's Coronavirus Pandemic or the deflation phase of the housing bubble from 2007 to 2011.
According to MarketWatch, that may be because potential home sellers are becoming "trapped" in their current homes thanks to the increase in mortgage rates.
There is evidence that having a low 30-year fixed mortgage rate is holding people back from moving. This feeling of being “stuck” has resulted in a very low number of new listings on the market.
New listings are down by 25% as compared to a year ago, Redfin said in a recent report, the biggest drop since May 2020 during the spread of the coronavirus.
Unsold housing inventory was at a 2.6-month supply, as of the latest count at the end of February, based on a report from the National Association of Realtors.
“Inventory levels are still at historic lows,” Lawrence Yun, chief economist at the NAR, said in that report....
Home buyers have in recent months been pushed into new builds, unable to find good options in the resale market.
The National Association of Home Builders said on Monday that historically, only about 10% of the housing inventory was new construction — now new builds make up one-third of the total inventory.
That's a viable explanation for why the new home market is rising despite the increase of mortgage interest rates. The plus side of this situation is that new home sales are providing a tailwind to the economy, because that's the part of real estate market that adds the most to the nation's GDP. The minus side is that a growing number of Americans are having to pass on being able to pursue new opportunities because they cannot afford to move out of their existing homes.
References
U.S. Census Bureau. New Residential Sales Historical Data. Houses Sold. [Excel Spreadsheet]. Accessed 27 June 2023.
U.S. Census Bureau. New Residential Sales Historical Data. Median and Average Sale Price of Houses Sold. [Excel Spreadsheet]. Accessed 27 June 2023.
Image credit: Photo by Thayran Melo on Unsplash.
Labels: real estate
Welcome to the blogosphere's toolchest! Here, unlike other blogs dedicated to analyzing current events, we create easy-to-use, simple tools to do the math related to them so you can get in on the action too! If you would like to learn more about these tools, or if you would like to contribute ideas to develop for this blog, please e-mail us at:
ironman at politicalcalculations
Thanks in advance!
Closing values for previous trading day.
This site is primarily powered by:
CSS Validation
RSS Site Feed
JavaScript
The tools on this site are built using JavaScript. If you would like to learn more, one of the best free resources on the web is available at W3Schools.com.


