China's economy appears to entered a situation where it's not getting the GDP output that should go along with the carbon dioxide emissions its generating to support it.
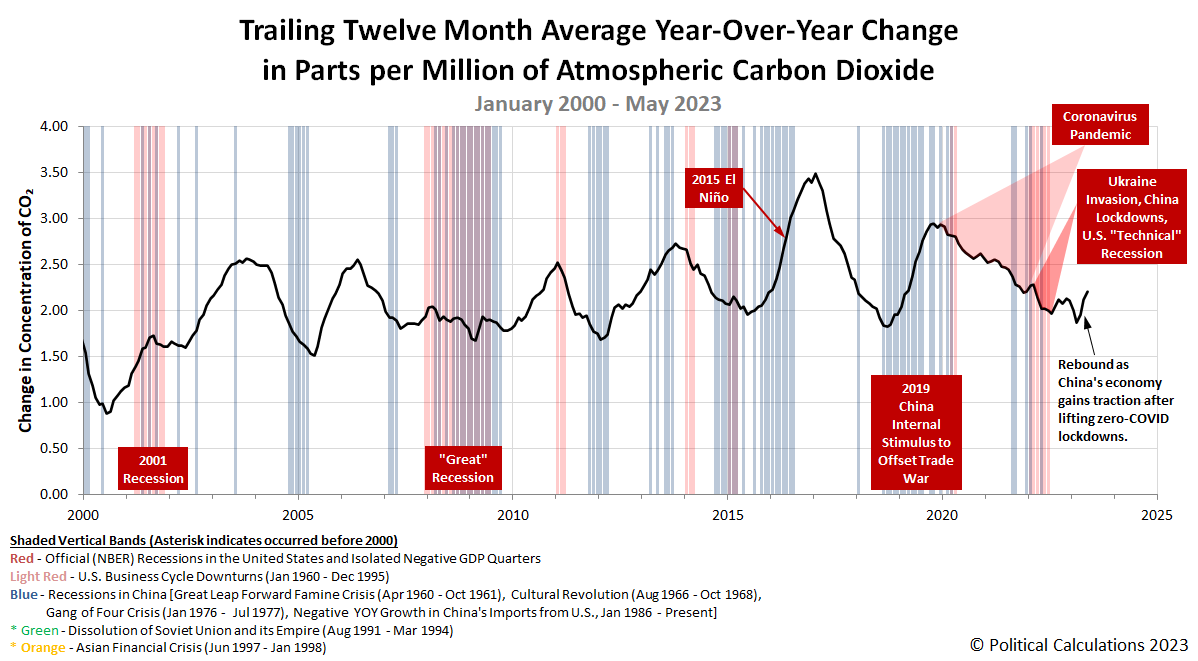
The Chinese government's efforts to stimulate its economy are continuing to show up as a significant increase in the rate at which CO₂ accumulates in the air. Unfortunately, international trade data suggests China's post-COVID lockdown stimulus is not going as its leaders may have hoped.
The result is economic output that's not keeping pace with its carbon dioxide emissions, which have already set a new record in the first quarter of 2023.
Those records, meanwhile, are expected to continue being broken during 2023.
China’s carbon dioxide emissions are set to hit an all-time high in 2023 based on first-quarter trends and domestic projections, likely topping the previous peak in 2021, according to a new report.
Carbon emissions by the world’s top emitter grew 4 per cent in the first quarter of 2023 compared to a year earlier to hit a record high for the period. This was driven by an economic rebound after the end of China’s long zero-Covid policy, stimulus measures and weak hydropower generation due to an ongoing drought, according to analysis on Friday by UK-based climate science and energy policy website Carbon Brief and the Finland-registered research organisation Centre for Research on Energy and Clean Air (CREA).
The following chart shows the latest rise in the rate of CO₂ accumulation in the Earth's atmosphere, which is based on measurements of its changing concentration taken by the Mauna Loa Observatory.
Much of China's emissions are being fueled by burning coal in electricity generation plants. This month featured a story of how Chinese importers are swooping in to buy as much of it up as they can while it's cheap.
China’s purchases may hit 360 million to 380 million tons in 2023, according to its top industry association. That compares with 293 million tons last year, and a record of 327 million tons set in 2013.
The nation’s buying spree, particularly for the higher grades that its own miners struggle to produce, coincides with easing energy prices in the European Union after last year’s spike caused by Russia’s invasion of Ukraine. That’s luring cargoes at discounted rates from as far afield as South Africa and Colombia.
While Beijing is keen to stock up on its mainstay fuel as air-conditioning demand soars heading into the summer, the extra volumes would land in a market that’s contending with disappointing industrial consumption and already well-supplied by record domestic production.
We often make the point that China is, by far and away, the world's biggest emitter of carbon dioxide. To close out this month's look at changes in global CO₂ concentrations, we thought featuring this excerpt from a Canadian perspective was a worthwhile initiative*:
Take China. It is now the biggest polluter, by far. Its emissions more than doubled between 2002 and 2010, as Canada’s flatlined. China’s emissions grew at a pace equivalent to adding an extra Canada’s worth of carbon into the atmosphere each year, for eight years in a row. China’s growth has since slowed; it’s now adding new carbon emissions at rate of one Canada every two years.
China produces a third of the world’s emissions, more than all of the developed world. That’s more than 20 times Canada’s carbon output.
Perhaps like comparing land areas to the "size of Wales", we should make Canadian CO₂ output levels a global standard of measure.
References
National Oceanographic and Atmospheric Administration. Earth System Research Laboratory. Mauna Loa Observatory CO2 Data. [Text File]. Updated 9 May 2023.
* In memory of the Worthwhile Canadian Initiative blog, whose last post was in November 2021!
Image source: Photo of Coal Furnace by N509FZ via Wikimedia Commons. Creative Commons. Attribution-ShareAlike 4.0 International (CC BY-SA 4.0).
Labels: environment
Welcome to the blogosphere's toolchest! Here, unlike other blogs dedicated to analyzing current events, we create easy-to-use, simple tools to do the math related to them so you can get in on the action too! If you would like to learn more about these tools, or if you would like to contribute ideas to develop for this blog, please e-mail us at:
ironman at politicalcalculations
Thanks in advance!
Closing values for previous trading day.
This site is primarily powered by:
CSS Validation
RSS Site Feed
JavaScript
The tools on this site are built using JavaScript. If you would like to learn more, one of the best free resources on the web is available at W3Schools.com.

