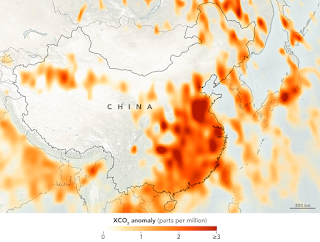
China became the world's biggest emitter of carbon dioxide into the Earth's atmosphere in 2006. Since then, its emissions have continued to increase, dwarfing the CO₂ output of every other nation on the planet by a widening margin.
China's emissions have become so large that even if China and every other nation were to freeze their CO₂ emissions at 2021's levels, China would still overtake the United States' historic emissions as the largest single national contributor of carbon dioxide emissions currently in the atmosphere by 2030. And since its emissions have increased substantially since 2021, China will almost certainly claim that top spot before the 2020s have ended.
China's carbon emissions are so large that we can increasingly use atmospheric carbon dioxide measurements to get a sense of how its economy is performing. Which is to say we can see whether its economy is speeding up or slowing by how the pace at which CO₂ accumulates in the air is changing.
The latest data from the remote Mauna Loa Observatory indicates China's economy has been slowing in recent months. Not that such evidence wasn't already apparent through trade data and China's increasing efforts to stimulate its economy over that time, but it's a kind of confirmation all the same. The following chart showing the trailing year average of the year-over-year change in the pace of carbon dioxide accumulation in the atmosphere since January 2000 indicates its recent decline continued into September 2023.
Given China's outsize role in producing global carbon dioxide emissions, the implication that China's economic growth continued slowing through that time logically follows. In reality, because of the lag in time from when emissions enter and begin diffusing in the Earth's atmosphere until they reach the Mauna Loa Observatory and are measured, it's a lagging indicator, telling us what happened anywhere from one to three months earlier.
Speaking of China's economic growth prospects, here's where they stand in early October 2023:
Lackluster growth and rising uncertainty have focused the world’s attention on the state of China’s economy. After a strong start to 2023, Chinese economic activity has sharply fallen short of expectations.
Exports have collapsed. Consumption, production and investment have slowed, while inflation leveled out and the unemployment rate edged up. The Chinese renminbi hit new lows in August and September 2023, driven by worries about the domestic economy....
Economic activity probably suffered its last major drop in July 2023. August data suggests that the economy is bottoming out, albeit very gradually. Casual observation confirms that economic recovery was underway in September.
But not enough to prevent China's government from mulling a new, larger stimulus for the nation's economy.
China is considering raising its budget deficit for 2023 as the government prepares to unleash a new round of stimulus to help the economy meet the official growth target, according to people familiar with the matter.
Policymakers are weighing the issuance of at least 1 trillion yuan ($137 billion) of additional sovereign debt for spending on infrastructure such as water conservancy projects, said the people, asking not be identified discussing a private matter. That could raise this year’s budget deficit to well above the 3% cap set in March, one of the people said. An announcement may come as early as this month, another person said, though deliberations are ongoing and the government’s plans could change.
Ultimately, whatever they decide will have an impact on the pace at which the concentration of carbon dioxide increases in the Earth's atmosphere.
Image credit: XCO₂ anomaly over China by NASA's Orbiting Carbon Observatory-2 (OCO-2), 2014-2016. Public domain image.
Labels: economics, environment
Welcome to the blogosphere's toolchest! Here, unlike other blogs dedicated to analyzing current events, we create easy-to-use, simple tools to do the math related to them so you can get in on the action too! If you would like to learn more about these tools, or if you would like to contribute ideas to develop for this blog, please e-mail us at:
ironman at politicalcalculations
Thanks in advance!
Closing values for previous trading day.
This site is primarily powered by:
CSS Validation
RSS Site Feed
JavaScript
The tools on this site are built using JavaScript. If you would like to learn more, one of the best free resources on the web is available at W3Schools.com.

