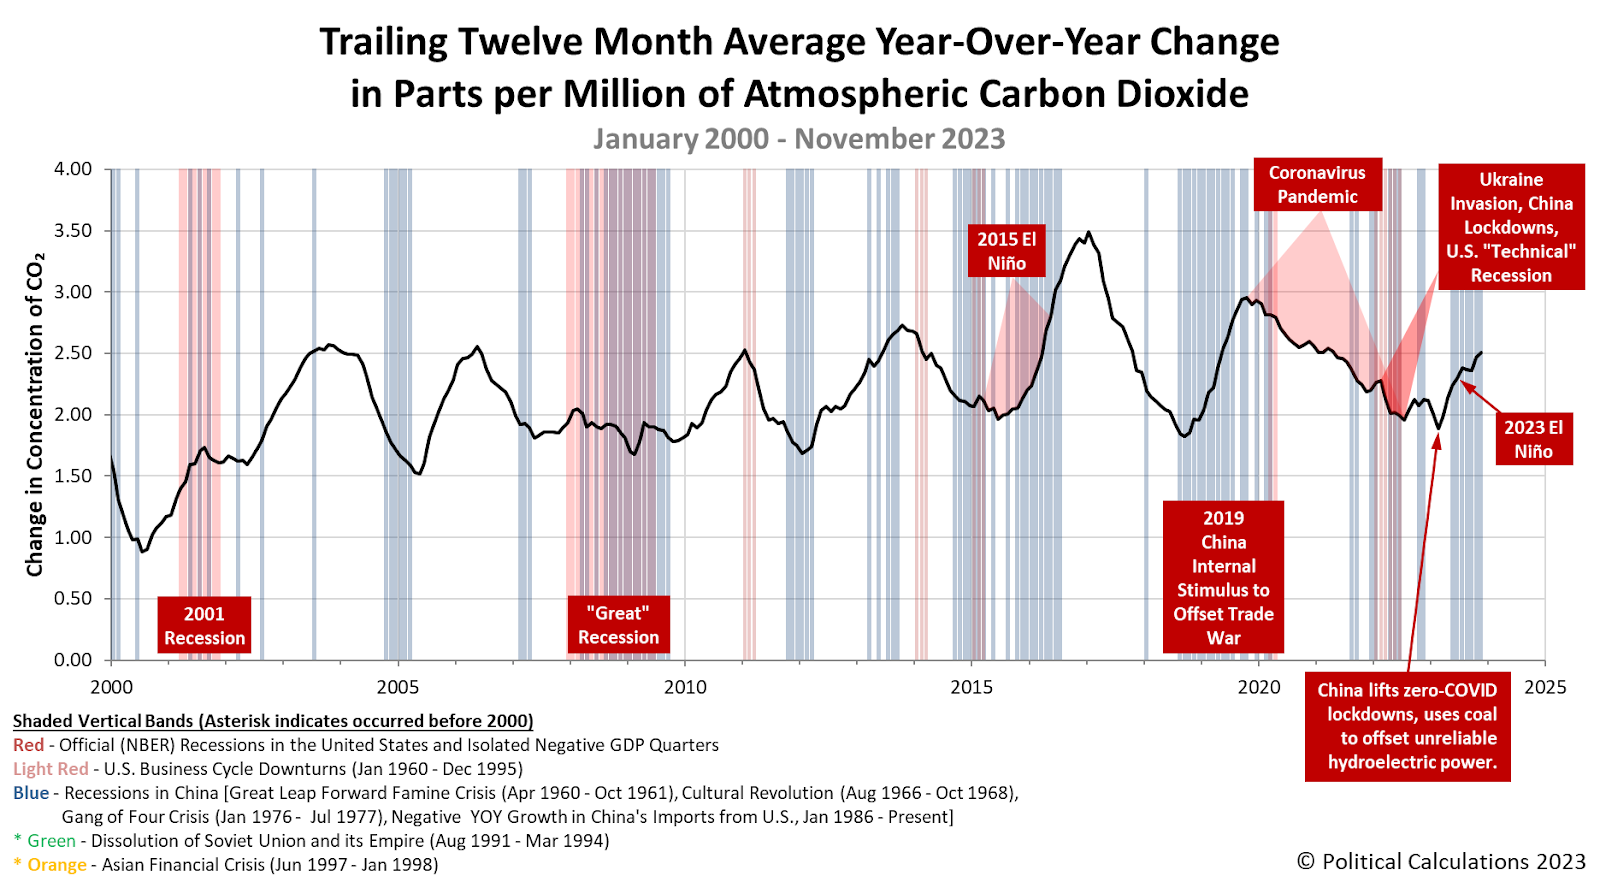
Over the past two months, China's economy has shown signs of greater economic growth. That change coincides with an increase in the rate at which carbon dioxide emissions are accumulating in the Earth's atmosphere. The increase reverses what had been a modest decline that coincided with sluggish economic growth in China.
When we talk about carbon dioxide as an economic indicator, we focus on China because that nation is, by far and away, the world's largest producer of carbon dioxide emissions. Given China's outsize role in global supply chains, these emissions provide can work as an indicator of global economic health in addition to China's.
We can illustrate China's role in producing carbon dioxide emissions by comparing its consumption of coal with the rest of the world. Over two-thirds of China's emissions come from from coal-fired power generation plants, so there's a very direct connection. The following chart summarizes the International Energy Agency's estimates of China, India and the rest of the world's consumption of coal, which is primarily used to generate electricity to support economic activity, for the years from 2020 through 2023.
In 2023, the IEA estimates China's consumption of coal accounted for nearly 56% of the total amount of coal consumed in the world. India, whose consumption of coal ranks second in the world, accounted for a little over 14% of the world's consumption. The entire rest of the world's coal consumption represents a little under 30% of the total.
Examining the chart more closely, both China and India have increased their consumption of coal since 2020, while the rest of the world has seen its consumption of coal decrease over this period (primarily in the U.S. and in the European Union). The increases in China and India however more than offset that reduction, with the result that the world's total coal consumption has increased in each year since 2020.
Unsurprisingly, China is responsible for most of that increase:
Coal power makes up about 70% of emissions in China, which has committed to being carbon neutral by 2060. After 2025, it is unclear whether China will approve new coal plants.
In the third quarter of this year, however, China permitted more new coal plants than in all of 2021, according to Greenpeace, even as most countries have stopped building new coal-fired power and are phasing out plants.
"With energy security becoming a code word for coal in recent years, there is a clear-cut path to receive approval on building more new coal while you still can," Greenpeace project leader Gao Yuhe said.
Xu Mingjun, general manager of Shenhua Energy, China's largest coal company, told investors in September that the company was taking advantage of this window of opportunity to bolster coal development.
More than 95% of the global coal plant capacity that began construction this year was in China, according to U.S. think tank Global Energy Monitor (GEM).
The expansion of China's coal-fired power generation capacity contributes to both economic growth within China, to the extent it does not substitute for other less reliable sources of electricity, and the nation's emissions of carbon dioxide. And by extension, the continuing accumulation of carbon dioxide in the Earth's air, as indicated in the next chart.
All indications point to China continuing to expand its coal-based power generation capacity through the end of 2025. The big question for these next two years is whether the global economy can support it?
References
International Energy Agency. Global coal consumption, 2020-2023. [Online data]. 28 July 2022.
International Energy Agency. Global coal consumption, 2021-2023. [Online data]. 27 July 2023.
National Oceanographic and Atmospheric Administration. Earth System Research Laboratory. Mauna Loa Observatory CO2 Data. [Online Data]. Updated 5 December 2023. Accessed 8 December 2023.
Image credit: Flickr/Wikimedia Commons. Power Plant (Tianjin, China) by Shubert Ciencia. Creative Commons. CC BY 2.0 DEED Attribution 2.0 Generic.
Labels: economics, environment
Welcome to the blogosphere's toolchest! Here, unlike other blogs dedicated to analyzing current events, we create easy-to-use, simple tools to do the math related to them so you can get in on the action too! If you would like to learn more about these tools, or if you would like to contribute ideas to develop for this blog, please e-mail us at:
ironman at politicalcalculations
Thanks in advance!
Closing values for previous trading day.
This site is primarily powered by:
CSS Validation
RSS Site Feed
JavaScript
The tools on this site are built using JavaScript. If you would like to learn more, one of the best free resources on the web is available at W3Schools.com.


