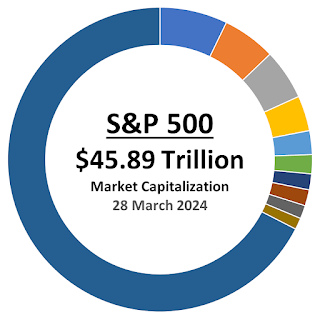
The first quarter of 2024 has come and gone. Before it did, the S&P 500 (Index: SPX) clocked a new record high of 5,254.35 The index ended 2024-Q1 with a market cap of $45.89 trillion according to Standard and Poor.
The Top 10 stocks within the market cap-weighted index together accounted for 32.5% of its total valuation. That's up from the 30.9% share that the S&P 500's Top 10 stocks held at the end of 2023.
It would be a mistake however to assume that all the biggest stocks just got bigger over the past three months. At the end of December 2023, Apple (NASDAQ: AAPL) was the biggest company in the S&P 500 with a market cap of $2.81 trillion. At the end of March 2024, Apple's valuation shrank to just under $2.6 trillion, falling to second place in the index.
Microsoft (NASDAQ: MSFT) has become the biggest company in the S&P 500 with a market cap of nearly $3.3 trillion as of 28 March 2024, rising from a $2.79 trillion figure we reported three months ago.
But that's not the only change for the top ten companies of the S&P 500 in the last three months. The following chart shows the relative shares of the top 10 stocks in the S&P 500 at the end of the first quarter of 2024.
Three months ago, both Tesla (NASDAQ: TSLA) and JP Morgan Chase (NYSE: JPM) were members of the S&P 500's Top 10 stocks. They've been replaced by Eli Lilly (NYSE: LLY) and Broadcom (NASDAQ: AVGO). Meanwhile, Nvidia (NASDAQ: NVDA) rocketed upward to become the third largest company in the S&P 500, passing several long-running members of the index' top ten on its rapid ascent.
Here are the market capitalizations of each of the S&P 500's top ten component firms:
- Microsoft (NASDAQ: MSFT) $3,294,823,648,250 (7.18%)
- Apple (NASDAQ: AAPL) $2,597,312,235,250 (5.66%)
- Nvidia (NASDAQ: NVDA) $2,459,645,509,000 (5.36%)
- Amazon (NASDAQ: AMZN) $1,720,834,078,125 (3.75%)
- Meta Platforms (A) (NASDAQ: META) $1,160,989,391,375 (2.53%)
- Alphabet (A) (NASDAQ: GOOGL) $926,955,956,750 (2.02%)
- Alphabet (C) (NASDAQ: GOOG) $780,111,448,750 (1.70%)
- Berkshire Hathaway (B) (NYSE: BRK.B) $780,111,448,750 (1.70%)
- Eli Lilly & Co. (NYSE: LLY) $647,033,613,375 (1.41%)
- Broadcom (NASDAQ: AVGO) $563,615,416,881 (1.23%)
The remaining 495 firms of the S&P 500 index account for 67.5% of its total market valuation.
References
Standard and Poor. S&P Market Attributes. [Excel Spreadsheet]. 28 March 2024. Accessed 29 March 2024.
Labels: market cap, SP 500
Welcome to the blogosphere's toolchest! Here, unlike other blogs dedicated to analyzing current events, we create easy-to-use, simple tools to do the math related to them so you can get in on the action too! If you would like to learn more about these tools, or if you would like to contribute ideas to develop for this blog, please e-mail us at:
ironman at politicalcalculations
Thanks in advance!
Closing values for previous trading day.
This site is primarily powered by:
CSS Validation
RSS Site Feed
JavaScript
The tools on this site are built using JavaScript. If you would like to learn more, one of the best free resources on the web is available at W3Schools.com.

