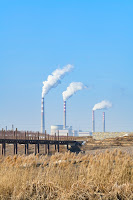
China's ongoing efforts to stimulate its economy are showing up as a significant increase in the pace of CO₂ accumulation in the Earth's atmosphere. The latest data covering the month of April 2023 is consistent with a surge of economic activity during the preceding month.
That's not much of a surprise. Last month, we observed early indications the Chinese economy was finally gaining traction after the Chinese government lifted its zero-COVID lockdowns at the end of 2022. What is surprising is how rapidly the rate at which carbon dioxide accumulates in the Earth's atmosphere is increasing following the turn in direction for China's economic momentum.
The latest evidence of that upward momentum can be seen in the following chart. It shows a significant increase over last month for the change in the concentration of atmospheric carbon dioxide measured by the remote Mauna Loa Observatory.
But how long might that surge continue?
Reports indicate China's economic activity unexpectedly cooled during April 2023, the effects of which would be expected to show up in atmospheric CO₂ data during the next two months.
For its part, China's government is still going gangbusters in trying to stimulate its economy. During the first three months of 2023, local governments in China approved more new coal-fired power plants than they did in all of 2021.
That matters because China is, by a very wide and increasing margin, the world's biggest national producer of carbon dioxide emissions. And since China's export-oriented economy supplies much of the world with consumer goods, changes in the rate at which those emissions accumulate in the air tell us quite a lot about the relative health of the global economy.
References
National Oceanographic and Atmospheric Administration. Earth System Research Laboratory. Mauna Loa Observatory CO2 Data. [Text File]. Updated 9 May 2023.
Image source: Photo by Cajeo Zhang on Unsplash. The same power station is identified and depicted at closer range in Paul Sonders' photograph at FineArtAmerica/Getty Images.
Labels: economics, environment
Welcome to the blogosphere's toolchest! Here, unlike other blogs dedicated to analyzing current events, we create easy-to-use, simple tools to do the math related to them so you can get in on the action too! If you would like to learn more about these tools, or if you would like to contribute ideas to develop for this blog, please e-mail us at:
ironman at politicalcalculations
Thanks in advance!
Closing values for previous trading day.
This site is primarily powered by:
CSS Validation
RSS Site Feed
JavaScript
The tools on this site are built using JavaScript. If you would like to learn more, one of the best free resources on the web is available at W3Schools.com.

