 We've previously commented on how the users of our reckoning and visualizing recession probability tools might be able to make best use of them in forecasting if a recession will materialize within the context of another article, but this topic really deserves its own post.
We've identified the 50% probability level as being a key threshold for telling if the economy will move toward recession sometime over the next 12 months, but there's an interesting question that should be asked: if the current probability of recession is hovering around the 50% mark, what has to happen to tip the balance enough to make the call?
To answer this question, we tapped the Federal Reserve's historical records for each of the components that goes into the recession probability calculation. We loaded up our spreadsheet software with the available data, ran the numbers, and found a recurring pattern as the U.S. economy approached the 50% probability mark.
We'll spare you the spreadsheet, but the pattern is essentially this:
- The probability of recession in the next four quarters bounces around the 50% mark for a short period of time, typically for one to two weeks.
- Then, the probability of recession grows significantly past the 50% mark in a relatively short period of time.
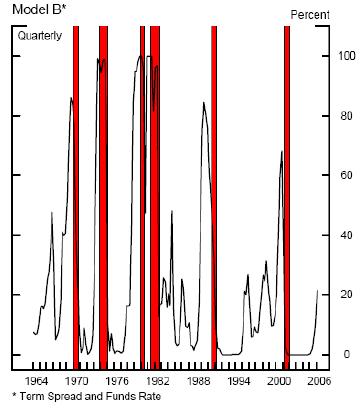
That latter point is illustrated by this chart from Jonathan Wright's paper:

The chart above shows two periods where the odds of recession spiked up near the 50% level, then receded with no following recession, in both 1966 and 1983. Meanwhile, when a recession does follow crossing the key 50% threshold, the probability of recession grows significantly past this point.
As for our first point, the "bounciness" we see in our figures is a direct result of our tool's making use of the daily data for the bond spread and federal funds rate components of the formula. In his original paper, Jonathan Wright uses the average of these figures over a three month period (our thanks to a sharp-eyed reader for pointing this out!) This approach has the advantage of reducing the volatility in the data. This reduced volatility allows the user to discount any unusual spikes that might be seen in using the daily data and be sure that the probability has truly edged up over the 50% mark.
There are two disadvantages to averaging the values of the data components over a 90-91 calendar day period. The first is that in the case that the probability of recession occurring is slowly, yet consistently increasing, it delays the prediction of a recession until the averages finally reach the 50% probability level. The second is more practical – there aren't any online sources of which we're aware that have already averaged the daily values of the last 90-91 days of bond spread and federal funds rate data together for you, which means that you have to do the averaging yourself!
That's why we're opting to leave our tool unchanged and to simply point this fact out for your reference!
So, recession hounds, if you're looking to predict a recession, that's what you need to see and to consider before you can confidently make the call. Tally ho!

Labels: forecasting, recession forecast
Welcome to the blogosphere's toolchest! Here, unlike other blogs dedicated to analyzing current events, we create easy-to-use, simple tools to do the math related to them so you can get in on the action too! If you would like to learn more about these tools, or if you would like to contribute ideas to develop for this blog, please e-mail us at:
ironman at politicalcalculations
Thanks in advance!
Closing values for previous trading day.
This site is primarily powered by:
CSS Validation
RSS Site Feed
JavaScript
The tools on this site are built using JavaScript. If you would like to learn more, one of the best free resources on the web is available at W3Schools.com.