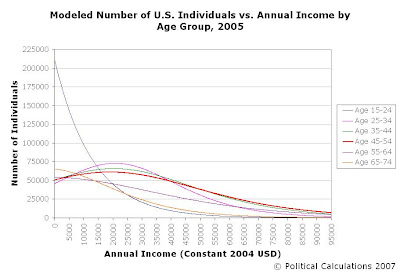
Using the distributions we previously created to model the cumulative representation of income-earning individuals by age group for both 1995 and 2005, we've now extracted the number of income-earners by annual income! First, here's the distribution we've modeled for 1995:

And here's the distribution we've modeled for the same age groups and constant 2004 U.S. dollar income range for 2005:

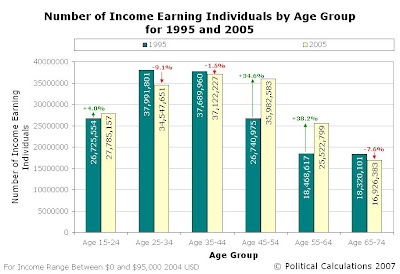
We'll be comparing each age group's distribution in a later post (and introducing a tool that will allow you to find the number of income earners within any income range from $0 to $95,000 constant 2004 U.S. dollars, but in the meantime, here's a direct comparison of the totals for each age group across our income spectrum:

Here's something to think about over the Memorial Day Holiday - in this last chart, we see that a major demographic shift in the number of income-earning persons in the U.S. has occurred in this 10-year period, primarily in the Age 45-54 and Age 55-64 groups, which both saw the number of individuals within each age range leap by 34.6% and 38.2% respectively. Meanwhile, we see that by comparison, the number of income-earning individuals in the other age ranges were either flat or saw moderate decreases.
Since we've already established that the Age 45-54 range for both 1995 and 2005 represents the peak earning years for U.S. individuals, what do you suppose the effects of this demographic change would be upon the distribution of income within the United States during this period? In other words, what effect would this change within the U.S. workforce have upon income inequality in the United States?
Update: For the curious, the two charts at the top of this post show the number of individuals within each consecutive $100 interval from $0 to $95,000 in constant 2004 U.S. dollars!
Labels: income, income distribution, income inequality
Welcome to the blogosphere's toolchest! Here, unlike other blogs dedicated to analyzing current events, we create easy-to-use, simple tools to do the math related to them so you can get in on the action too! If you would like to learn more about these tools, or if you would like to contribute ideas to develop for this blog, please e-mail us at:
ironman at politicalcalculations
Thanks in advance!
Closing values for previous trading day.
This site is primarily powered by:
CSS Validation
RSS Site Feed
JavaScript
The tools on this site are built using JavaScript. If you would like to learn more, one of the best free resources on the web is available at W3Schools.com.