Now that health care has once again become a primary political topic in the United States, and since the largest survey ever in examining how the nations of Europe fare with respect to cancer survival rates has been released, we thought we might compare the U.S. with Europe!
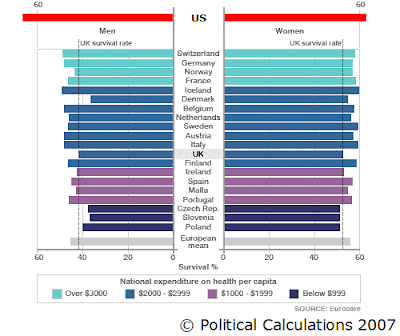
We adapted a graphic from the BBC showing how the United Kingdom compared with the other nations included in the Eurocare 4 study to include the U.S. below. The chart illustrates the percentage of those diagnosed with cancers of all types who survive at least five years after their initial diagnosis:

The Times confirms the difference between U.S. and European cancer survival rates:
Europe’s survival rates are lower than in the US, where 66.3 per cent of men and 62.9 per cent of women survive for five years, compared with 47.3 per cent of European men and 55.8 per cent of women.
The Times indicates that the difference in 5-year cancer survival rates may be a result of earlier diagnosis in the U.S. compared to European nations. An opinion by the Center for Science in the Public Interest's Merrill Goozner on his blog suggests that the earlier diagnosis rate may be the result of additional tests ordered by U.S. doctors:
A cancer epidemiologist would probably explain the data this way: In the U.S., we conduct far more tests, which turn up many more cancers. That in turn leads to higher survival rates because we wind up treating some cancers at an earlier stage. It probably even saves some lives that otherwise would have been lost to the disease.
But there's a downside to all those tests. They have relatively high false positive rates. In other words, they turn up minor cancers that may never have progressed to full-blown neoplasms. Yet, they are treated anyway since determining which ones will progress is impossible at that early stage.
All in all, the quality of cancer treatment in the United States offers a powerful indication why high-ranking individuals in other nations might pass up the health care systems in their own countries and travel to the U.S. for treatment.
Previously on Political Calculations
- Natural Life Expectancy in the United States
Where would the U.S. rank in the world if fatal injuries that are independent of the health of individuals who die from them, such as those from motor vehicle accidents and homicides, are taken into account in international life expectancy data?
- Estimating Your Life Expectancy
Our tool can help you estimate how many more years you can statistically look forward to! Plus, we link to other tools that let you account for the things that can affect your health.
- Redefining the Health Care Debate - Part 1
We broke apart the United States to better describe the relationship between health care spending and national economic output.
- "Fighting Malaria with Math"
We took on the scourge of malaria with a tool based on math that can help better target malaria control efforts.
- The Cost of Risk vs. Benefit
When is it worth taking a medical test for which there's little chance that you'll benefit? Our tool can help you answer the question - plus the same math applies if you're looking to play the lottery!
- Pigou Taxing Your Food
u.K.-based researchers have proposed an excise tax for food they deem unhealthy. We run the numbers to find out how much money U.K. taxpayers would have to shell out and also find out how much it will cost to delay one obesity-related death by one year!
- A Clouded Eye on Socialized Health Care
What happens when a national health care bureaucracy gets to define what constitutes medical necessity? We tell the story of an elderly woman with cataracts....
- Should You Go To the Doctor?
Our very much tongue-in-cheek tool can help you decide if you should seek medical treatment for that embarrassing condition of yours!
Labels: health care
Welcome to the blogosphere's toolchest! Here, unlike other blogs dedicated to analyzing current events, we create easy-to-use, simple tools to do the math related to them so you can get in on the action too! If you would like to learn more about these tools, or if you would like to contribute ideas to develop for this blog, please e-mail us at:
ironman at politicalcalculations
Thanks in advance!
Closing values for previous trading day.
This site is primarily powered by:
CSS Validation
RSS Site Feed
JavaScript
The tools on this site are built using JavaScript. If you would like to learn more, one of the best free resources on the web is available at W3Schools.com.