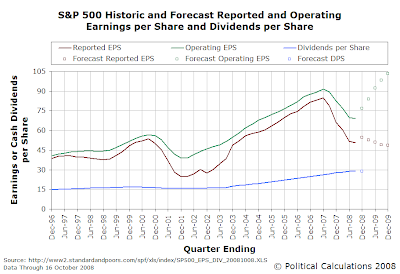
How has the future of S&P 500 company earnings changed since December 2007? To answer that question, let's go back to our post Do Drops in Corporate Earnings Lead to Recession?, in which we created a graph to show the earnings and dividends per share that Standard & Poor had recorded or was projecting for the index at that time:

Let's now update that chart to show what S&P thinks the future of earnings will look like in 2009. In the chart below, we've omitted core earnings per share since that data has not been updated past December 2006 in the S&P 500 Earnings and Estimates spreadsheet:

This chart helps explain why stock prices are declining. We see that dividends per share, the key driver of stock prices, is flattening out through the end of 2008, and we've already noted that they will decline into and through mid-2009.
That decline is a direct response to the declining earnings picture for the companies of the S&P 500, as reflected by their reported earnings per share. Since dividends per share represent what companies believe to be their "sustainable" level of earnings, the reduction in the expected level of reported earnings per share from which cash dividends are drawn is now pushing stock prices lower.
We see that the forecast value of $48.52 trailing year reported earnings per share is just 57.1% of the peak value of $84.92 reached in June 2007.
On a side note, it appears that S&P's forecast for S&P 500 company operating earnings per share is wildly optimistic. Look for those values to be lowered in future revisions.
Labels: dividends, earnings, SP 500, stock market
Welcome to the blogosphere's toolchest! Here, unlike other blogs dedicated to analyzing current events, we create easy-to-use, simple tools to do the math related to them so you can get in on the action too! If you would like to learn more about these tools, or if you would like to contribute ideas to develop for this blog, please e-mail us at:
ironman at politicalcalculations
Thanks in advance!
Closing values for previous trading day.
This site is primarily powered by:
CSS Validation
RSS Site Feed
JavaScript
The tools on this site are built using JavaScript. If you would like to learn more, one of the best free resources on the web is available at W3Schools.com.