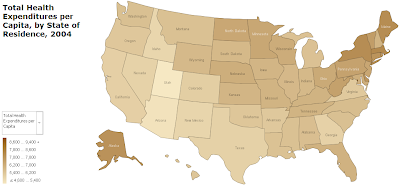
The first chart we created this morning simply presents the total health expenditures per capita by state of residence for 2004 (Many Eyes also makes an interactive version of this map available).
We next crunched some numbers to determine how each state's total health expenditures per capita would fall with respect to the value we would predict based upon each's GDP per capita. The following chart presents our results as a percentage of the value we would expect given the actual GDP per capita of each using the refined relationship we presented last week (interactive version available here).

That these three states also represent some of the poorest in the United States helps explain why. It's very likely that health expenditures in these states are boosted by a significant contribution by the U.S. federal government, well beyond the level that would be supported by each's economic output, for the purpose of "equalizing" them with other U.S. states. We can confirm this as the chart presenting the total health expenditures per capita (see above right) shows that each state's total health spending per capita is largely in line with many of their neighboring states.
It's likely a similar mechanism is at play for the next six states that fall well above what we would predict their level of health expenditures per capita would be based upon their GDP per capita. These states include Alabama, Arkansas, Kentucky, Montana, South Carolina and Vermont, which all range between 130 and 150% higher that the level we would anticipate. The District of Columbia would also fall in this range at 141.5% of the level of health expenditures per capita that we would anticipate, even given its outsize GDP.
The remaining 41 states would then all be within 30% of the level of total health expenditures per capita that we would predict based on the GDP per capita of each.
Labels: data visualization, health care
Welcome to the blogosphere's toolchest! Here, unlike other blogs dedicated to analyzing current events, we create easy-to-use, simple tools to do the math related to them so you can get in on the action too! If you would like to learn more about these tools, or if you would like to contribute ideas to develop for this blog, please e-mail us at:
ironman at politicalcalculations
Thanks in advance!
Closing values for previous trading day.
This site is primarily powered by:
CSS Validation
RSS Site Feed
JavaScript
The tools on this site are built using JavaScript. If you would like to learn more, one of the best free resources on the web is available at W3Schools.com.