 Stock prices, we find, behave as though they are driven by a combination of signal and noise. The signal is provided by the fundamental elements that underlie stock prices, namely changes in the expected future growth rate of trailing year dividends per share with respect to initial conditions set by previous stock prices. And though we would estimate that signal controls the direction and level of stock prices around 70% of the time, noise is always present and affects the level of stock prices the remainder of the time.
Noise is what we observe behind the recent decline in stock prices, which we've seen plunge from a level for the S&P 500 of 923.33 on 1 July 2009 to the closing value of 881.03 on 7 July 2009.
During that time, we've observed just one event that has reduced what investors would expect for the future level of dividends, which came as timber and forest products producer Weyerhaeuser slashed their dividend by 80%, from 25 cents per share to just 5 cents per share.
Even with that change, using the math that describes how stock prices work with the dividend futures available through 8 July 2009, we find that we would still place our target range for the S&P 500 in the near term between 925 and 945.
 Digging deeper into the bear cave, we considered the possibility that the recent decline in stock prices might be the result of investors shifting their focus from the dividends per share expected at the end of the year (given by the dividend futures for the first quarter of 2010 - dividend futures contracts for the fourth quarter of 2009 ends on 20 December 2009.) Shifting that focus toward the farther future produces much higher projections for stock values, shifting it backward to the nearer term produces much lower projections for stock values than where they've actually gone, so we're ruling out a change in investor focus as a factor at this time.
We next wondered if investors were instead altering the level from which they base stock prices. We've found that typically, investors base the future level of stock prices upon the average level of stock prices of a year ago and the change over that time, but we have observed changes in that frame of reference, which sets the initial level from which changes in stock prices are determined in our methods.
That also failed to produce changes of the magnitude that we have observed in the past week, so we will rule out, for now, this factor as a potential cause.
That leaves just one other factor that can generate the changes in stock prices that we've observed in the past week: noise.
 For our math, the effects of noise are incorporated into the amplification factor that we use to correlate changes in the expected future growth rate of trailing year dividends per share with changes in the growth rate of stock prices. Since 2001, we've observed that this amplification factor has generally run between a level of 7.0 and 11.0 and, for our recent stock price projections, between 7.0 and 9.0.
To reach the level of stock prices that we observe for 7 July 2009, combined with the changes in the signal-driven components of our stock price math, this factor would need to drop to a level of 1.0.
What this result tells us is that the current market action is likely the result of speculative noise - investors would appear to be anticipating rather significant cuts to corporate dividends per share, but are doing so with as yet little evidence to support that speculation.
The question is what's driving that speculation?
Inside the Noise
To answer that question, we need to go within the S&P 500, to find out which of the index' sectors are pulling the index downward.
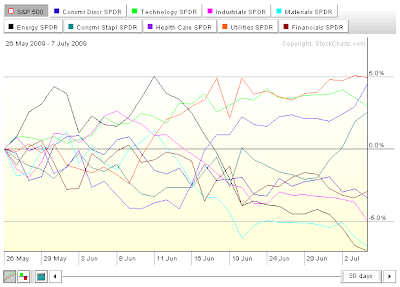
We used StockCharts Sector SPDR PerfChart, which allows us to compare the S&P 500's various sectors against the baseline performance of the S&P 500 as a whole. Doing that, we created the following chart in looking back over the previous 30 days of market activity:

Here, we see that Energy stocks have dived lower, as the price of oil has fallen with speculation of lower economic growth in the world, we see that Materials and Industrials stocks have likewise dipped for the same reason, while Technology stocks have contributed to the decline by having pulled back from recent increases.
The question that remains to be answered is whether this speculation, if it does come to pass, will materialize in a lower expected growth rate of dividends per share that will provide the fundamental basis for lower stock prices. The thing about noise is that while we might be able to identify some sources and their duration, we cannot do so for other sources, such as those that now appear to be driving the market.
Perhaps the nicest thing about the theory of stock prices that we've developed is that it tells us when it works and when it doesn't!
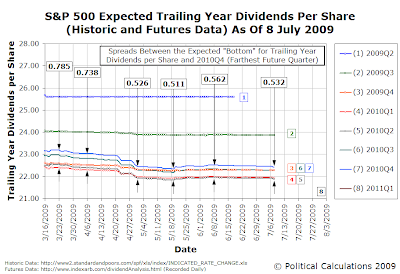
We'll close this post with our chart showing the spread between what investors expect for where trailing year dividends per share will bottom and the farthest quarter into the future for which our source for dividend futures data provides data:

Note to Roubini: investors have not been expecting a V-shaped recovery for quite some time. As Barry Ritholtz might put it, they're expecting "less bad...."
Labels: chaos, SP 500, stock market
Welcome to the blogosphere's toolchest! Here, unlike other blogs dedicated to analyzing current events, we create easy-to-use, simple tools to do the math related to them so you can get in on the action too! If you would like to learn more about these tools, or if you would like to contribute ideas to develop for this blog, please e-mail us at:
ironman at politicalcalculations
Thanks in advance!
Closing values for previous trading day.
This site is primarily powered by:
CSS Validation
RSS Site Feed
JavaScript
The tools on this site are built using JavaScript. If you would like to learn more, one of the best free resources on the web is available at W3Schools.com.