to your HTML Add class="sortable" to any table you'd like to make sortable Click on the headers to sort Thanks to many, many people for contributions and suggestions. Licenced as X11: http://www.kryogenix.org/code/browser/licence.html This basically means: do what you want with it. */ var stIsIE = /*@cc_on!@*/false; sorttable = { init: function() { // quit if this function has already been called if (arguments.callee.done) return; // flag this function so we don't do the same thing twice arguments.callee.done = true; // kill the timer if (_timer) clearInterval(_timer); if (!document.createElement || !document.getElementsByTagName) return; sorttable.DATE_RE = /^(\d\d?)[\/\.-](\d\d?)[\/\.-]((\d\d)?\d\d)$/; forEach(document.getElementsByTagName('table'), function(table) { if (table.className.search(/\bsortable\b/) != -1) { sorttable.makeSortable(table); } }); }, makeSortable: function(table) { if (table.getElementsByTagName('thead').length == 0) { // table doesn't have a tHead. Since it should have, create one and // put the first table row in it. the = document.createElement('thead'); the.appendChild(table.rows[0]); table.insertBefore(the,table.firstChild); } // Safari doesn't support table.tHead, sigh if (table.tHead == null) table.tHead = table.getElementsByTagName('thead')[0]; if (table.tHead.rows.length != 1) return; // can't cope with two header rows // Sorttable v1 put rows with a class of "sortbottom" at the bottom (as // "total" rows, for example). This is B&R, since what you're supposed // to do is put them in a tfoot. So, if there are sortbottom rows, // for backwards compatibility, move them to tfoot (creating it if needed). sortbottomrows = []; for (var i=0; i
We're still playing around with the data visualization tools on Many Eyes, this time using a block histogram to confirm the disproportionately high total health expenditures per capita of Maine, Mississippi and West Virginia! The histogram we've created (interactive version here) shows just how far separated these three states are from the rest of the United States, which are otherwise concentrated most heavily around the U.S. average of 105%.
The percentage given is that provided by the ratio of the actual total health expenditure per capita for each U.S. state with respect to the value we would predict given each state's GDP per capita.
The geographic presentation of this same data is to the left. While we get a sense of the degree to which Maine, Mississippi and West Virginia stand out with respect to their neighboring states based on this measure, these charts don't convey the actual level of total health expenditures per capita for these states.
For that, we'll turn to our geographic chart depicting each state's total health expenditures per capita.
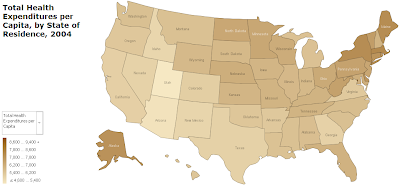
Here, we see that instead of being disproportionately high with respect to their neighboring states, the level of total health expenditures per capita for Maine, Mississippi and West Virginia are instead consistent with many of their surrounding states (the exception is New Hampshire, which has a disproportionately low level of health expenditures per capita compared to its neighbors.)
As we noted yesterday, the likely explanation for this result is that contributions from the U.S. federal government likely "equalize" the level of health expenditures per capita in these states with other states in their region.
That, in turn, would make one of the rare examples of when the U.S. government has successfully, to borrow Thomas Sowell's phrasing, "equalized upward" (HT: Mark Perry). We should note that the practical effect of the current universal health care proposals being drafted by the Obama administration and the current majority party of the U.S. Congress would be to change the emphasis from this approach to instead equalize downward.
Finally, we'll once again confirm that whenever we see levels of spending way out of whack with the levels we would normally expect based on sound economic fundamentals, the government is usually involved.
Labels: data visualization, health care
Welcome to the blogosphere's toolchest! Here, unlike other blogs dedicated to analyzing current events, we create easy-to-use, simple tools to do the math related to them so you can get in on the action too! If you would like to learn more about these tools, or if you would like to contribute ideas to develop for this blog, please e-mail us at:
ironman at politicalcalculations
Thanks in advance!
Closing values for previous trading day.
This site is primarily powered by:
The tools on this site are built using JavaScript. If you would like to learn more, one of the best free resources on the web is available at W3Schools.com.