We've also projected into September 2009, where we would expect that, at best, the S&P 500 will be mostly flat with respect to its average value in August 2009.
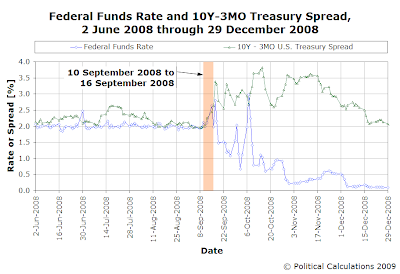
But that ignores the effects of what we've hypothesized to be a predictable source of noise that can affect the level of stock prices: the unwinding of the hedging strategy of bond traders in response to a narrowing of the spread in U.S. Treasuries.
Here, we anticipate that the narrowing of the Treasury yield spread of a year ago, for which bond market traders utilized stock options and stock purchases as a means of hedging against the implicit inflation risk implied by such a change, will result in a larger than average number of shares being sold in the stock market as the related options and bond required holding periods expire. The resulting increase in the quantity of shares being sold will, without a corresponding increase in the quantity demanded for shares, result in falling stock prices.
We last saw this kind of activity take place in June 2009, the noise from which resulted in the S&P 500 just missing our target range for the month. Consequently, we expect a similar outcome in this month, as this event would appear to be scheduled to occur around the dates from 10 September 2009 to 16 September 2009.
Suspecting then that stock prices can be expected to go significantly lower during this month, we plan to sell the index fund that closely tracks the S&P 500, which also represents all our retirement savings, later this week. We suppose we could wait for next week, but we don't expect much in the way of additional gains by holding out that much longer. We'll likely do so this Thursday, as we plan for an extended holiday weekend and would rather not have to worry about the market.
We'll look at resuming our investment after the dust clears....

Which, as our chart indicates, they did....
We think that would be the equivalent of reversing the polarity on Star Trek - instead of stock prices falling a year later as bond traders unwind their hedged positions, we would expect that additional funds would come out of the bond market to buy stocks, driving their prices upward.
It's still a disruptive noise event, in that this change in stock prices is not (as yet) supported by a corresponding change in the expected future growth rate of their dividends per share, so the effect of this noise upon stock prices will have an expiration date.
Which suggests to us that the market will have a significant selling opportunity in the near future, sometime soon after 16 September 2009.
We'll just have to wait and see....
Labels: chaos, forecasting, SP 500
Welcome to the blogosphere's toolchest! Here, unlike other blogs dedicated to analyzing current events, we create easy-to-use, simple tools to do the math related to them so you can get in on the action too! If you would like to learn more about these tools, or if you would like to contribute ideas to develop for this blog, please e-mail us at:
ironman at politicalcalculations
Thanks in advance!
Closing values for previous trading day.
This site is primarily powered by:
CSS Validation
RSS Site Feed
JavaScript
The tools on this site are built using JavaScript. If you would like to learn more, one of the best free resources on the web is available at W3Schools.com.