 Once upon a time, we created a tool that makes it possible to predict how high U.S. politicians will set the maximum personal income tax rate in the U.S., depending upon three things:
- The size of the U.S.' national debt.
- The nation's GDP, and;
- Its population.
This exercise is especially timely now that President Obama and his Democratic Party are pushing to hike that top rate to 49%, which includes the so-called "Buffett tax", it's time to see how well our tool works.
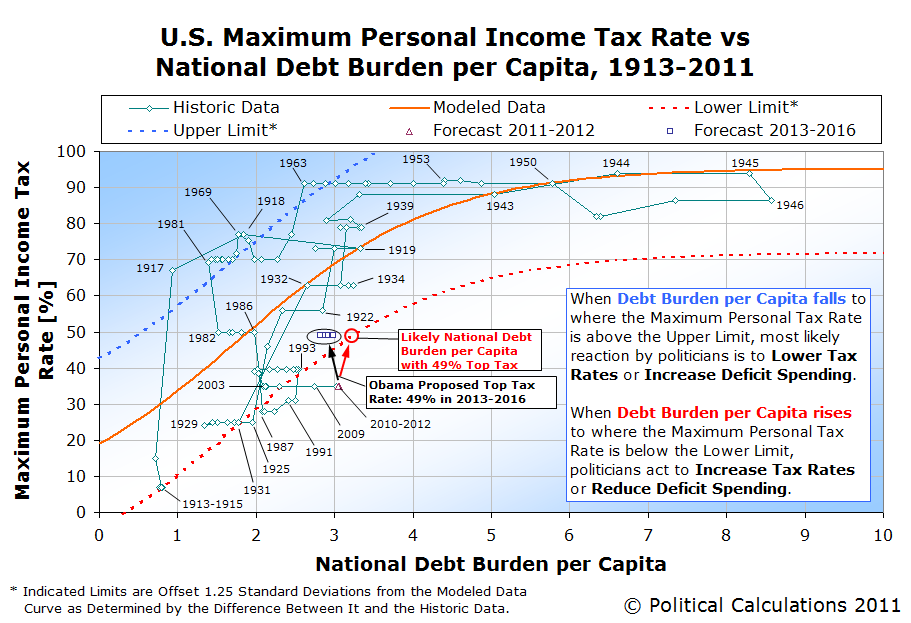
Using our tool with the default data, we find that today's national debt burden per capita scores in at 3.168, which translates to an "old school" maximum income tax rate of 71.5%. Modern politicians are a different breed however, preferring to stay closer to the margins where changes in the nation's maximum personal income tax rate are likely to be triggered for the political advantages such a strategy offers. Our tool finds that they would set the top tax rate at 48.0%.
President Obama and the congressional Democrats are currently proposing to raise the top tax rate to 49.0% 50.0%.
We should note that the real difference between the "old school" and "modern" politicians is that the "old school" politicians didn't actually know where the margins for triggering changes in the top income tax rate are - it's something that's had to be worked out by political trial and error. It has really only been since the late 1960s, and really, since the 1980s, that U.S. politicians appear to have registered any sort of recognition that these margins exist.
Comparing Today with the Past
The first time we featured this tool back in April 2009, the U.S. national debt was only 11.15 trillion dollars, U.S. GDP was 14.2 trillion dollars and the U.S. population was estimated to be 306,170,293. The national debt burden per capita was 2.565, which corresponds to an "old school" top tax rate of 62.1%. Modern politicians would the top tax rate would be somewhere close to 40% with that old data. And President Obama was, at the time, seeking to let the Bush-era tax cuts expire, which would push the top marginal income tax rate up to 39.6%.
The reason today's predicted maximum income tax rate has risen to 48.0% since that time is completely due to President Obama's spending, which has significantly driven up the national debt.
Of course, we foresaw that President Obama would push for higher income tax rates back in December 2009 as well, finding that the sharp rise in the national debt through that point in time would likely result in the maximum personal income tax rate in the U.S. being set somewhere between 44 and 45%.
And that's exactly where they're currently set to rise in 2013, thanks to the new taxes that congressional Democrats and President Obama imposed through the Patient Protection and Affordable Care Act (aka "Obamacare").
Adding in President's Obama and the congressional Democrats' "Buffett Tax" of 5.4% is how we get to the new proposed top income tax rate of 49% 50%.
Which either means that they're overshooting where they should set the top income tax rate, or are planning to crank up spending and the national debt even more to make that rate seem to make sense.
Updating the Chart
As you might imagine, tracking the interaction between the United States' national debt, GDP, population and U.S. politicians for the sake of predicting how high they might try to set the maximum personal income tax rate gets pretty complicated. Fortunately, we have a chart that visualizes all this data, which incorporates President Obama's optimistic national debt and GDP forecasts through 2016:

What can we say? President Obama is nothing else if not depressingly predictable. We've had his number for a pretty long time now....
Update 13 October 2011: We re-did the math and found the top personal income tax rate would rise to 50.0%.
Labels: forecasting, taxes, tool
Welcome to the blogosphere's toolchest! Here, unlike other blogs dedicated to analyzing current events, we create easy-to-use, simple tools to do the math related to them so you can get in on the action too! If you would like to learn more about these tools, or if you would like to contribute ideas to develop for this blog, please e-mail us at:
ironman at politicalcalculations
Thanks in advance!
Closing values for previous trading day.
This site is primarily powered by:
CSS Validation
RSS Site Feed
JavaScript
The tools on this site are built using JavaScript. If you would like to learn more, one of the best free resources on the web is available at W3Schools.com.