Today, we're going to start by looking directly at the evidence that would seem to support the case that Baby Boomers are making out much better than younger Americans in the Great Recession in the second part of our three-part series.
Here, we'll start by showing the number of individuals counted within each approximately five-year long age grouping recorded by the BLS as being employed in November 2006 and November 2011. Only the data for the very youngest, Age 16-19, and oldest, Age 75 and older, cover different age ranges. The data shown in our first chart applies to the BLS' non-seasonally adjusted figures for each of the indicated age groups:

Comparing the recorded values for the same age groupings in November 2006 with those for November 2011, we find that there would indeed appear to be a significant shift favoring Americans over the age of 50.
We can see that move clearly if we focus in the differences recorded in the values from November 2006 to November 2011, as shown in our second chart:
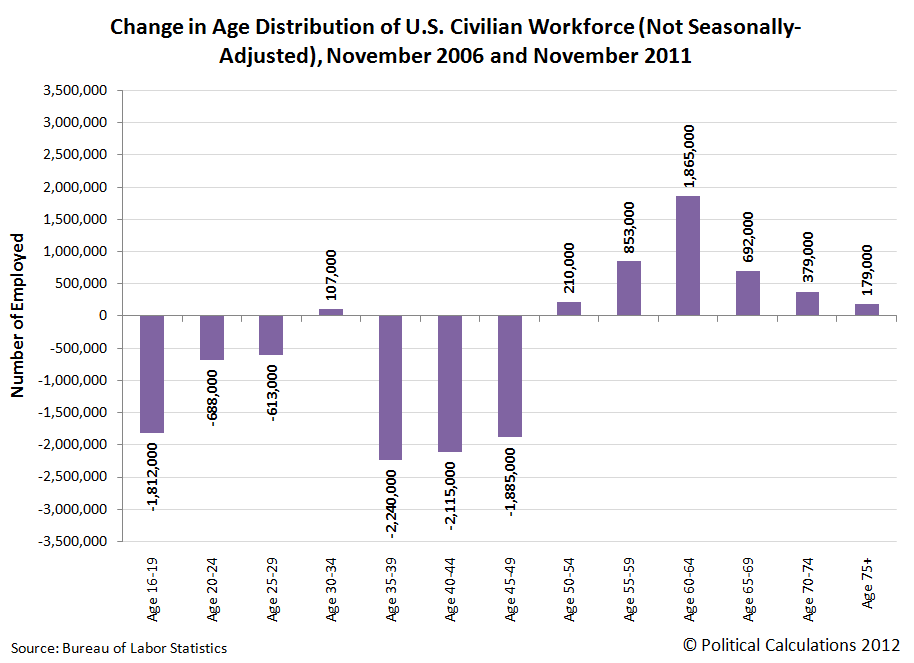
We observe that the age distribution of the U.S. workforce would appear to have shifted strongly in favor of those Age 50 and older.
Surprisingly though, we see that teens would appear to only be the fourth most negatively-affected age grouping, with the top three most-negatively affected being those Age 35 to 39, Age 40-44 and Age 45 to 50. Teens however would indeed be the most negatively affected age grouping once you take their total numbers in the U.S. workforce into account, as the total non-seasonally adjusted number of people with jobs in this age group has been reduced by over 30% from November 2006 to November 2011.
We observe that even though the Age 35-39, Age 40-44 and Age 45-49 groups had seen larger declines in their workforce numbers than U.S. teens, because so many more people in these age ranges are employed, the declines are much smaller as a percentage share of the working population for each group than it is for teens.
The age group with the largest increase in the number of individuals recorded as having jobs from November 2006 to November 2011 is the Age 60 to 64 cohort, which would represent many of the leading edge of the Baby Boom generation, which spans the years from 1946 through 1964. Individuals Age 60-64 in 2011 were born between the years of 1947 and 1951.
Unfortunately, these charts don't tell the whole story. That's because nearly all of the people in the indicated age ranges in our charts for November 2011 are not the same people who were recorded in these same age groupings in November 2006. The only exception is for the Age 75+ age grouping, which is a catchall grouping for the oldest employed Americans.
As an illustration of what we mean when we say that we aren't dealing with the same people, let's consider the individuals who were between the ages of 45 and 49 in November 2006. These are definitely not the same people who are included in the Age 45-49 age grouping in November 2011's jobs data, because they were all five years older by the time November 2011 rolled around. And because that's the case, you really can't say what happened to the net number of working people in 2006's Age 45-49 grouping by looking at that same category in 2011.
Unless you take their aging into account. If you really want to find out what happened five years later with the net employment situation of working people who were between the ages of 45 and 49 in November 2006, you need to look at the people who were between the ages of 50 and 54 in November 2011.
So that's what we've done! Our results are graphically presented below in our third chart:

Starting with the lowest age grouping on the chart, we find that those Age 16-19 in November 2011 saw their ranks within the U.S. workforce grow by roughly 4,177,000, at least compared with how many of their peers had jobs when they were between the ages of 12 and 15 in November 2006. Likewise, we see the greatest number of individuals join their peers in the U.S. workforce for the Age 20-24 group in the five years from November 2006 to November 2011, and we see a much smaller gain for those who waited until they reached the ages of 25 to 29.
Basically, what we're seeing with these younger ages are people entering into the U.S. work force within each age peer group. Going back to our first and second charts, and in particular, for the youngest age grouping of Age 16-19, we observe that these numbers are far reduced from their levels in November 2006, which indicates that jobs for teens that existed in 2006 no longer exist for the teens of 2011, which we observe in the total decline of employed individuals in this age range and which we can say with confidence because the population of teens was largely stable throughout these years.
What is more interesting though for this period of time applies for the older age groups, where it is clear that people are exiting the work force. Here we find that every older peer group, spanning the ages of 25 upward, saw their number of peers in the U.S. workforce decline in the five years from November 2006 to November 2011.
Some of that you might expect, especially once individuals reach retirement age, where many individuals in the U.S. tend to begin retiring around Age 60, while others hold on until they reach the normal retirement age to receive full Social Security benefits at or not long after Age 65.
But what you wouldn't necessarily expect is to see so many individuals between the ages of 30 to 55 exit the U.S. workforce during this time. This negative net change covers working age people who had jobs in November 2006, but were no longer counted as being employed in November 2011.
That covers a pretty big portion of the Baby Boom generation, the youngest members of which, born in 1964, would be 47 years old in 2011. We would therefore estimate that over 3 million of these individuals between the pre-retirement ages of 47 and 55 prematurely left the U.S. workforce during these five years.
Clearly, many people, including a good portion of the Baby Boomers, have left the U.S. workforce in the five years from November 2006 to November 2011. But how much is due to "normal" factors like retirement and how much might be recession-driven? And if the oldest workers are really the least affected by the recession, the question is why?
In the third and final part of our series, we'll do our best to answer these questions....
Previously on Political Calculations
- Are Baby Boomers Stealing Jobs from the Young? (Part 1)
- Generations
- How Much Are Geezers Displacing Teens from the U.S. Workforce?
Labels: demographics, jobs
Welcome to the blogosphere's toolchest! Here, unlike other blogs dedicated to analyzing current events, we create easy-to-use, simple tools to do the math related to them so you can get in on the action too! If you would like to learn more about these tools, or if you would like to contribute ideas to develop for this blog, please e-mail us at:
ironman at politicalcalculations
Thanks in advance!
Closing values for previous trading day.
This site is primarily powered by:
CSS Validation

RSS Site Feed
JavaScript
The tools on this site are built using JavaScript. If you would like to learn more, one of the best free resources on the web is available at W3Schools.com.
Other Cool Resources
Blog Roll


