What's the real story with the changing age distribution of working Americans over the previous five years? We've previously shown that large declines in the working population of the U.S. has taken place across all age groups, but how much of that might be considered to be normal, such as in the case of retirement, and how much might due to other factors? Which age groups have been hurt the most during the Great Recession, and are there any that have made out the best?
To find out, we need to go back to the Employment to Population ratio that Jed Graham used to make his original point, only we'll calculate it for each of the age groupings for which the BLS collects data for both November 2006 and November 2011. We're doing a direct comparison of each of the five-year age cohorts we have been considering, so we'll capture the shift in the age distribution of the U.S. civilian labor force, with respect to the non-institutionalized population for each over that time.
Doing this will allow us to take factors like retirement into account for older Americans. Since the data for November 2006 is well outside the period covered by the so-called "Great Recession", being just over a year before that recession would rear its ugly head, comparing the more recent U.S. workforce data for November 2011 to it will allow us to see what percentage of people in each age range might have been pushed out from participating in the U.S. labor force by other factors, at least with respect to what we'll call a "normal", non-recessionary year like 2006.
Our results are presented in our first chart below:

Here, we see that all but the oldest age groups saw declines in the percentage of individuals within each population who were counted as being employed. Only those Age 65 or older did not see decreases in the percentage share of employed in the change from November 2006 to November 2011, which is interesting because that age cohort mainly covers the so-called "Silent Generation" - the generation that immediately preceded the Baby Boomers.
Our second chart shows the difference between November 2006 and November 2011's employment to population ratio for each age grouping:
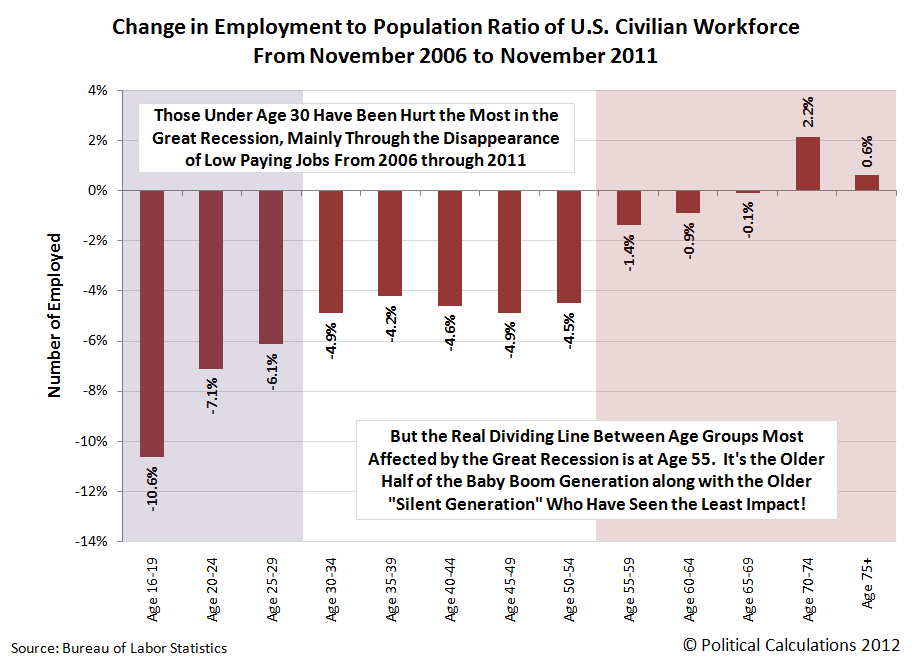
What we find it that those under Age 30 have been the most negatively affected, which we've previously observed to be the result of the disappearance of low paying jobs in the years since 2006. Here, these Americans are being hurt by not being able to even enter the workforce, which in turn, prevents them from gaining employment experience, and which in another turn, will limit their ability to earn higher incomes later in their working years.
The next most affected in the U.S. job market are those between Age 30 and Age 55, which includes roughly half of the Baby Boom generation. These individuals have primarily been hurt by the loss of jobs during the recession, with many of these jobs being lost from the Manufacturing and Trade and Transportation sectors of the U.S. economy during the large-scale automotive industry failures of late 2008 and early 2009.
But the age groups that have been the least affected are those over the age of 55. Here, the older half of the Baby Boom generation has seen little impact on their overall employment representation within their generation, while the older Silent Generation, which includes those over Age 65 in 2011, has actually seen their percentage of employed members in the U.S. workforce increase. Clearly, something has caused employers to strongly favor these individuals over all younger individuals in the five years from November 2006 to November 2011.
In the case of the members of the Silent Generation, we can definitely rule out demographic factors as being behind their apparent percentage increase in the U.S. civilian labor force, because their numbers are far fewer than the Baby Boom generation.
What Might Explain this Age-Based Job Discrimination?
When that kind of distortion exists, you can almost bank money that a perverse incentive for employers is at work - one where there are real world rewards and penalties driving the decisions for a very large number of employers. And because it would seem that a very large number of employers would appear to have acted the same way, you can almost be certain that the federal government is ultimately behind the observed distortion, which in this case, would seem to involve some very pronounced age discrimination.
As for what that might be in this case, let's consider why individuals Age 65 and older would be the only ones seeing real gains in the percentage of their population that has increased during the last five years. What characteristics do they share that might give them an edge for retaining their employment during a period of recession compared to all younger workers?
In considering what it really costs for an employer to have someone on their payroll, we find one major factor that might entirely explain what we observe: the cost of employer-provided health insurance for these individuals.
Here, since those over Age 65 are eligible to have Medicare coverage for their health insurance, that factor can put all younger workers at a competitive disadvantage in the economy, since employers would not need to provide their Medicare-eligible workers with other health insurance.
Put another way, if an employer that might otherwise struggle during a period of recession to generate enough revenue to stay in business can cut their employment costs by hiring people or retaining people on their payrolls who are eligible to have their health insurance costs covered by Medicare, instead of paying for more costly health insurance as they would have to for younger employees, they will greatly favor these individuals in the job market.
What's more, if they anticipate that those poor economic conditions will continue for some years into the future, they'll also hang onto their older employees who will soon be 65 years old, who will be likewise eligible to provide these companies with significant cost savings if they continue working.
Meanwhile, the more costly to employ younger Americans would bear the brunt of jobs lost or not even created under these economic conditions.
We find then that the young are indeed being discriminated against in the U.S. job market and that the federal government is indeed behind the perverse incentives promoting this kind of age discrimination, as the members of the Silent Generation and the older Baby Boomers are indeed being strongly favored by U.S. employers, most likely because of the economic distortions it is creating within the U.S. job market through its Medicare health insurance program.
The only problem for the younger workers being hurt in this situation is that because it is the federal government that has created the incentive to discriminate against them, only it can act to end the bias that it has succeeded in institutionalizing. Unfortunately for us all, the leaders of that government currently have no intention of ending this kind of age-based job discrimination anytime soon!
Previously on Political Calculations
- Are Baby Boomers Stealing Jobs from the Young? (Part 1)
- Are Baby Boomers Stealing Jobs from the Young? (Part 2)
- Generations
- How Much Are Geezers Displacing Teens from the U.S. Workforce?
- How Much Does It Cost to Employ You?
- Trending Health Insurance Costs
Labels: demographics, jobs
Welcome to the blogosphere's toolchest! Here, unlike other blogs dedicated to analyzing current events, we create easy-to-use, simple tools to do the math related to them so you can get in on the action too! If you would like to learn more about these tools, or if you would like to contribute ideas to develop for this blog, please e-mail us at:
ironman at politicalcalculations
Thanks in advance!
Closing values for previous trading day.
This site is primarily powered by:
CSS Validation

RSS Site Feed
JavaScript
The tools on this site are built using JavaScript. If you would like to learn more, one of the best free resources on the web is available at W3Schools.com.
Other Cool Resources
Blog Roll


