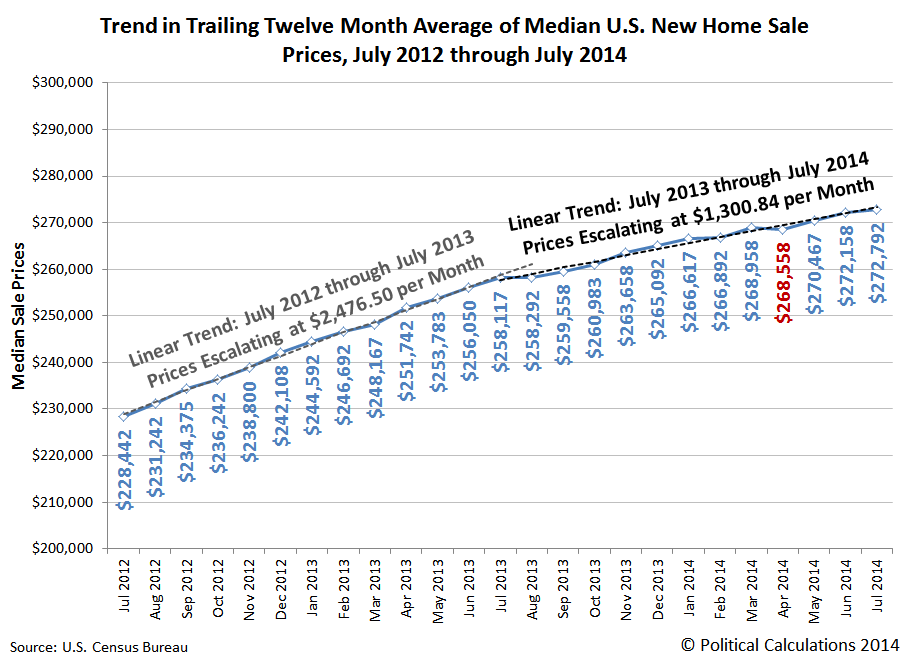
It's a mistake to treat housing prices as if they're a function of time. They're not. But we're going to treat them that way today to illustrate how differently the trend in median new home sale prices has behaved since institutional investors dialed down their year-long buying frenzy after July 2013. The chart below reveals what we find:
The initial inflation phase of the second U.S. housing bubble ran from July 2012 through July 2013. During that time, the trailing twelve month average of the median sale price of new homes sold in the United States increased at an average rate of approximately $2,476.50 per month.
From July 2013 through July 2014, the trailing twelve month average of the median sale price of new homes sold in the U.S. has increased at an average rate of $1,300.84 per month, just under 53% of the average rate recorded during the preceding 12 months.
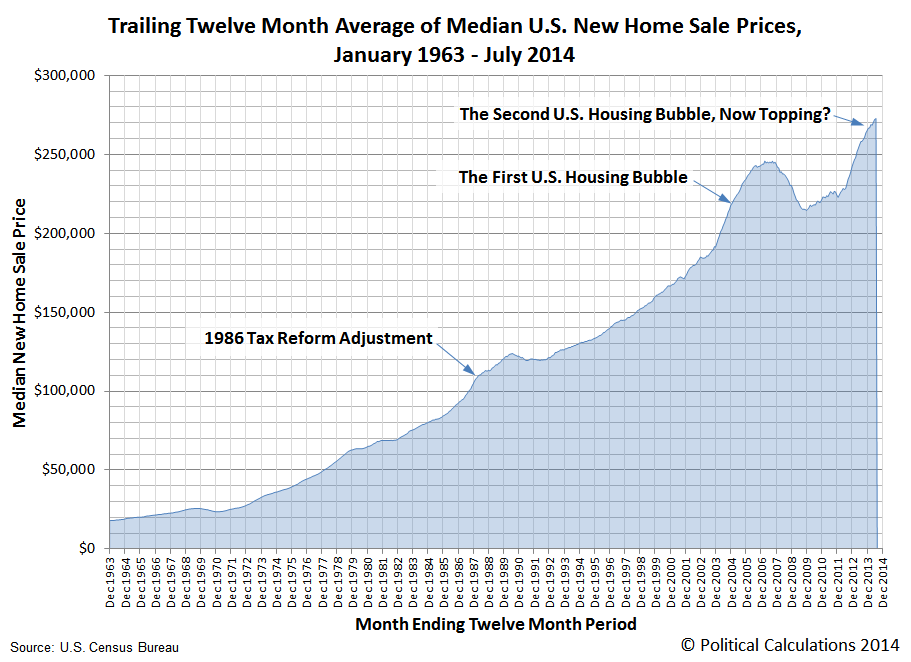
Here's the big picture for the trends in the trailing year average of median new home sale prices since January 1963, which is as far back as the U.S. Census Bureau provides the data:
The current temporal trend growth rate of $1,300.84 per month for median U.S. new home sale prices is still well elevated over the the typical linear growth rate of housing prices observed outside of economic bubbles in the U.S. housing market of roughly $397 per month.
Data Source
U.S. Census Bureau. Median and Average Sales Prices of New Homes Sold in the United States. [Excel Spreadsheet]. Accessed 25 August 2014.
Labels: real estate
Welcome to the blogosphere's toolchest! Here, unlike other blogs dedicated to analyzing current events, we create easy-to-use, simple tools to do the math related to them so you can get in on the action too! If you would like to learn more about these tools, or if you would like to contribute ideas to develop for this blog, please e-mail us at:
ironman at politicalcalculations
Thanks in advance!
Closing values for previous trading day.
This site is primarily powered by:
CSS Validation
RSS Site Feed
JavaScript
The tools on this site are built using JavaScript. If you would like to learn more, one of the best free resources on the web is available at W3Schools.com.

