Can monthly tax collection data predict recessions?
That's a question we realized we could answer as we went about solving a different problem. In working on that other problem, we were looking at the U.S. Social Security Administration's data on the taxes it collects each month to fund Part A of the Medicare program (hospital insurance), where we noted that the amount of taxes collected showed a cyclical pattern - one that seemed to correspond to recessions.
That's significant because Medicare's Hospital Insurance tax is levied against all wage and salary income earned by Americans and has been fixed at a steady 2.90% (1.45% of total income paid by the individual wage or salary earner with another 1.45% paid by their employer as part of those FICA payroll taxes) since the early 1990s. And even though a there's a new 0.9% Medicare tax that has been imposed on the wage, salary and investment income of high income earners as part of Obamacare, unlike Medicare's hospital insurance tax, none of that money really goes to the Medicare program. It goes straight into the general fund of the U.S. Treasury instead.
That means that Social Security's data for its Medicare Hospital Insurance tax collections represents a simple, straight percentage of all the wage and salary income earned in the U.S. Which in turn means that we can perhaps use it as a decent indicator of the relative health of the U.S. economy.
Since there have only been two official periods of recession recorded since the early 1990s, which is all as far back as our data source goes, we focused just on the period since January 1999 to see if we can find any correlations between Medicare Hospital Insurance tax collections and the timing of recessions in the U.S. Here's our visualization of the raw data:
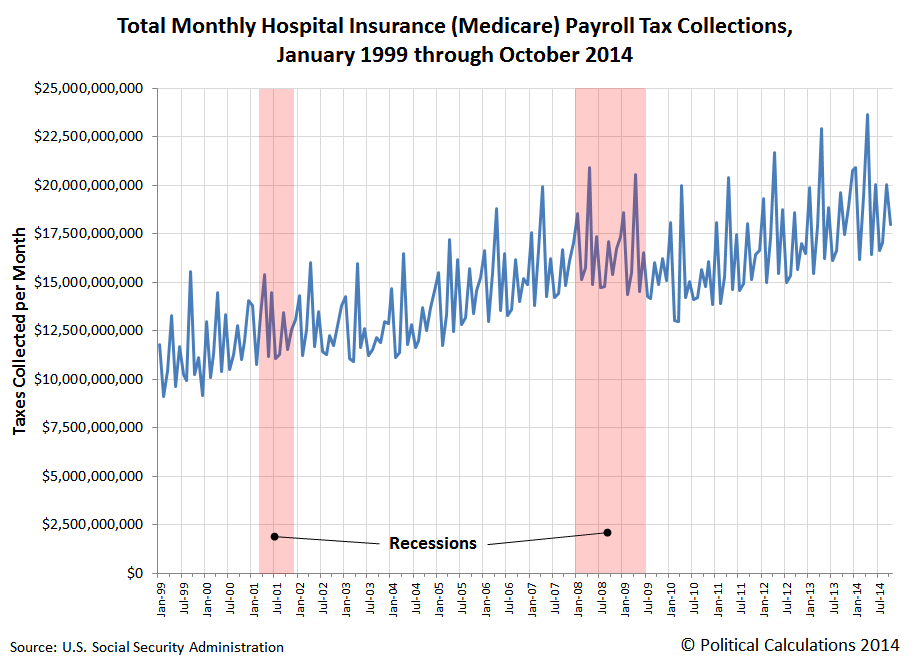
We see there's something there, but also that there's a lot of volatility from month to month, including seasonality in the data, with peaks in the data coinciding with quarterly and annual tax deadlines. To address those issues, we calculated the trailing twelve month average of the monthly Medicare Hospital Insurance payroll tax collections. The chart below shows what we found (the first data point, December 1999, reflects all the data from January through December of that year):

After this bit of analysis, we see that the payroll tax data for Medicare's Hospital Insurance tax is really a lagging indicator of the relative health of the U.S. economy when it falls into recession, which we see in the amount of taxes continuing to rise before stagnating and falling as recessions take hold. This observation is consistent with employers being slow to cut people from their payrolls or hours and pay during the early portion of official periods of recession.
But intriguingly, this data seems to also be a real time indicator of improving economic conditions, where employers act quickly to add staff when economic conditions demand it.
We can see that real time indicator at work in the latter half of 2013, when the U.S. economy experienced an organic growth spurt thanks to a record bumper crop of agricultural products, with the greatest growth occurring in the period from September through December, which corresponds to the harvest and export of major commercial crops in the U.S.
Through the projected tax collection data for October 2014, we don't see any similar sign of a surge in payroll tax collections, which suggests that there will not be a similar growth spurt in either incomes or jobs at the present time.
But also no sign of recession, which from what we can tell with the limited data available, wouldn't show up until well after a recession has officially begun.
Labels: recession forecast, taxes
Welcome to the blogosphere's toolchest! Here, unlike other blogs dedicated to analyzing current events, we create easy-to-use, simple tools to do the math related to them so you can get in on the action too! If you would like to learn more about these tools, or if you would like to contribute ideas to develop for this blog, please e-mail us at:
ironman at politicalcalculations
Thanks in advance!
Closing values for previous trading day.
This site is primarily powered by:
CSS Validation

RSS Site Feed
JavaScript
The tools on this site are built using JavaScript. If you would like to learn more, one of the best free resources on the web is available at W3Schools.com.
Other Cool Resources
Blog Roll


