Last Friday, we had a bit of fun as we made a big deal out of our having correctly anticipated the course of the S&P 500 during the preceding week. The chart below, excerpted from The Upshot (via Barry Ritholtz), shows why that was such a big deal.
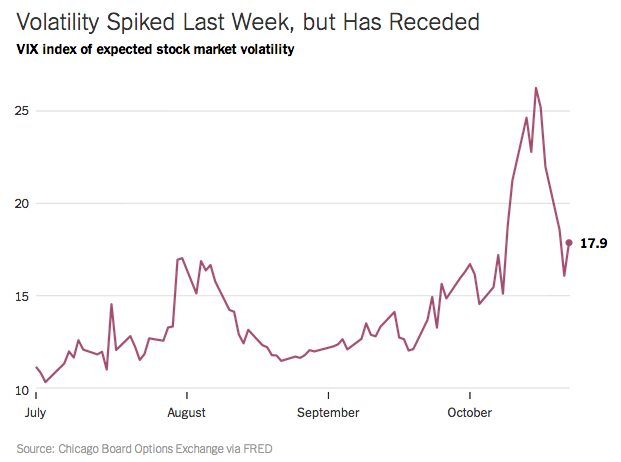
The ability to anticipate or cope with volatility is one of the major tests of any model of real world phenomena. In the case of our model of how stock prices work, there are two primary causes of volatility with which we're concerned:
- Special cause variation, where we observe changes in stock prices that are either consistent with identifiable shifts in the forward-looking attention of investors from one point of time in the future to another in setting their expectations of the future when making current day investment decisions, or that are the result of the reaction of investors to other identifiable factors that do not affect their fundamental expectations of the future, which we often describe as noise events.
- Common cause variation, where we observe variation, or typical levels of noise, that is driven by factors or frictions that are always present in the stock market.
Our standard model has done well in addressing both kinds of variation, which we've observed in spades since October 2014 began.
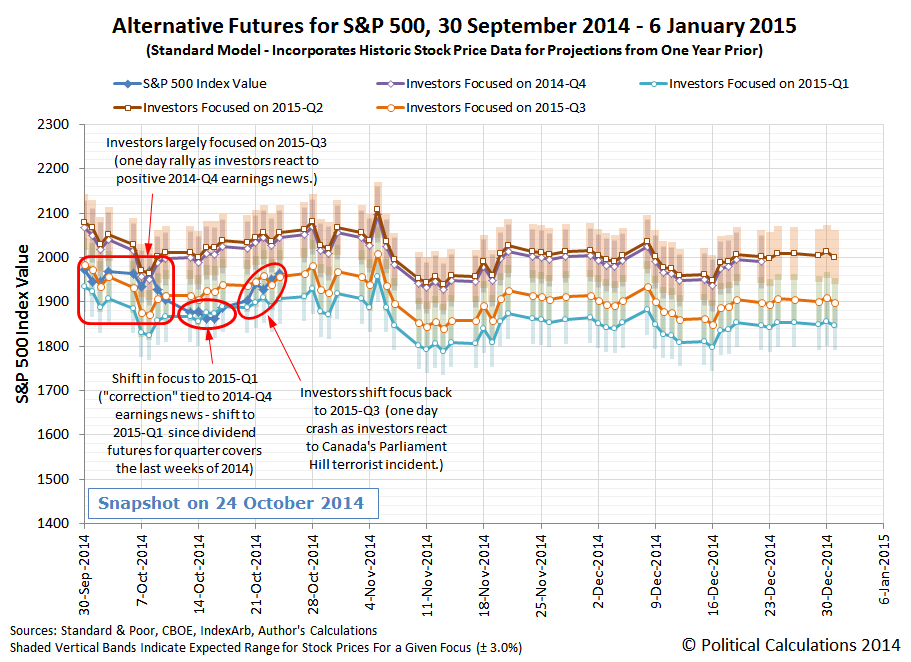
Looking forward through the next two weeks, we would anticipate that in the absence of noise or an announcement from the Fed specifying that they will begin hiking short term interest rates in 2015-Q2, which would prompt a shift in focus, investors will remain primarily focused on 2015-Q3 in setting their expectations as they set stock prices.
Our model would appear to project a very short term dip in stock prices in this upcoming week, with a short rally in stock prices in the following week. These are actually artifacts of our use of historic stock price data as the baseline reference points from which we project the future trajectory of stock prices, which are the result of echoes from short term noise events of a year ago - much like the one day rally was on 8 October 2014 and also the one day dip of 22 October 2014. We would anticipate that the actual trajectory of stock prices will more closely connect the "dots" on the opposite sides of both projected "events".
Looking further forward, if the Federal Reserve were to more clearly indicate that 2015-Q2 will be the most likely future quarter in which it will begin hiking interest rates, it will have an advantage in doing so if it communicates that intent in early November 2014.
Here, we note that if investors have reason to remain focused on 2015-Q3, the most likely future trajectory for stock prices will be lower through the end of the 2014. But if the Federal Reserve succeds in shifting the forward looking focus of investors to 2015-Q2, stock prices will shift to a trajectory that is flat to higher than they are today, which is something that the Fed might desire if it wants to maintain the appearance that U.S. markets have confidence in its plans.
That would also be the worst possible thing that the Federal Reserve could do if economic conditions in the U.S. are such that delaying its plan to begin hiking short term interest rates is warranted. That could potentially set up the situation where stock prices would "correct" by at least 5% while costing the Fed a portion of its credibility.
It's going to be fun watching the Fed this month and next!
Analyst Notes
The main reason we've been taking such an apparently self-congratulatory tone lately is because we've nearly reached the successful end of the basic development work for our years-long stock price forecasting project. With the bulk of that work now behind us, we're going to be increasingly moving on to other things.
We plan to somewhat regularly post updates of our forecast model's performance through the end of 2014-Q4, but we would only periodically comment on the S&P 500's stock prices as events might warrant after that point.
Welcome to the blogosphere's toolchest! Here, unlike other blogs dedicated to analyzing current events, we create easy-to-use, simple tools to do the math related to them so you can get in on the action too! If you would like to learn more about these tools, or if you would like to contribute ideas to develop for this blog, please e-mail us at:
ironman at politicalcalculations
Thanks in advance!
Closing values for previous trading day.
This site is primarily powered by:
CSS Validation

RSS Site Feed
JavaScript
The tools on this site are built using JavaScript. If you would like to learn more, one of the best free resources on the web is available at W3Schools.com.
Other Cool Resources
Blog Roll


