Since we're now outside of the anniversary period of 2013's U.S. debt ceiling crisis, the third and smallest of the major noise events of 2013, we're making the transition back to using our standard baseline model for use in forecasting and explaining changes in current day stock prices. Something that people like Catherine Rampell would not appear to believe is even possible.
Even though the period from 1 October through 17 October is somewhat affected by the echo effect's impact on our mathematical model of how stock prices work, it's pretty small in size. That's certainly true after we substitute the CBOE's dividend futures value for 2014-Q3 (of $9.895 per share) that we were previously using in our projections with S&P's final reported value for the quarter's dividends (of $10.023 per share). This change accounts for the upward shift in the trajectory associated with investors focused on the distant future quarter of 2015-Q3 compared to the version of this chart that we last posted nearly two weeks ago.

What we observe is consistent with stock prices either rebounding to the level that investors focused on 2015-Q3 would set them after having "overcorrected" for the misplaced rally of 8 October 2014, or perhaps more likely, briefly focusing on 2015-Q1, which could have been influenced by the earnings being reported by U.S. companies during the past week.
In both cases, to the dismay of the Rampells of the world, the current state of the U.S. economy carries no weight in the setting of stock prices, as investors are almost invariably looking beyond the present quarter as they make their investment decisions.
In fact, it's really pretty rare for investors to maintain any sort of focus on the current quarter in setting stock prices for any sustained period of time. There are really only two periods during the past six years where we've observed that sort of thing, which occurred when U.S. companies were either slashing their dividends in the current quarter, which played out as the crash from 26 September 2008 through 9 March 2009) or were acting to significantly boost their dividend payments to investors (15 November 2012 through 20 December 2012), where they were raiding the funds set aside to pay dividends in future quarters to beat the clock on the risk of major tax hikes as part of the Fiscal Cliff Crisis.
And since it's the changes in the growth rate of dividends that are directly proportional to the changes subsequently seen in the growth rate of stock prices as they respond to this fundamental signal as investors collectively focus on particular points of time in the future in making their investment decisions, let's take a look at what those expectations specifically are:
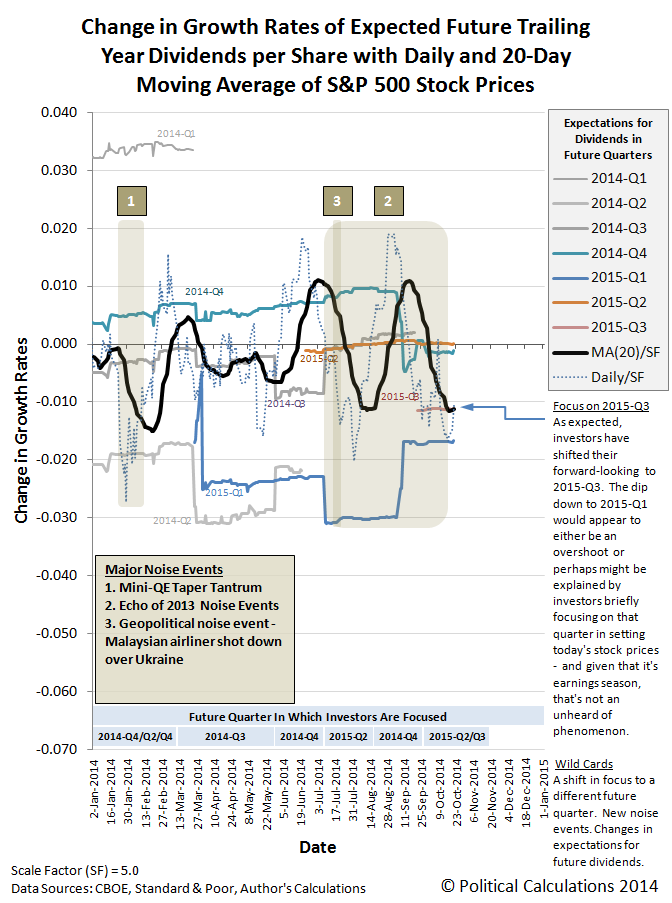
Looking forward, here is the level of dividends for the S&P 500 that investors are currently expecting to be paid in each of the following future quarters (according to the CBOE's dividend futures contracts as of 21 October 2014):
- 2014-Q4: $9.886 per share (*)
- 2015-Q1: $10.743 per share (*)
- 2015-Q2: $10.619 per share
- 2015-Q3: $10.712 per share
(*) All these values are based on dividend futures contracts, which run from the end of the preceding futures contract on the third Friday of the month ending the preceding quarter through the third Friday of the month ending the indicated quarter, and which project the dividends per share that will be paid out over that interval. These values will not match those reported by Standard and Poor for the S&P 500, since they report the dividends paid from the end of the month for one calendar quarter to the end of the next. Because of that difference, and because a lot of companies pay out their largest dividends before the end of the year, look for significant discrepancies between the CBOE's dividend futures and S&P's reported dividends for Q4 and Q1, with lesser adjustments for Q2's and Q3's dividends.
What these values do however tell us is that investors are expecting flat to lower dividend growth once we're in 2015. Which is why stock prices are most likely to head sideways or lower in the absence of an improving economic situation in the future that would prompt companies to boost their dividends in those future quarters.
What's more, the Federal Reserve shares our basic assessment, which we discovered in the reporting on the one topic that could suddenly cause investors to focus on the current quarter of 2014-Q4 in setting today's stock prices:
Mr. Bullard did not say he definitely wanted to extend the bond-buying program. No other Fed official has offered such speculation, and three—Boston Fed President Eric Rosengren, San Francisco Fed President John Williams and Dallas Fed President Richard Fisher—said in recent days they expect to end the purchases at their meeting Oct. 28-29.
The Fed’s policy committee has said recently the bond program would end this month. Barring a really tumultuous final 10 days of October, the panel “will almost certainly make that forecast come true,” analysts at Wrightson ICAP said.
More broadly, Fed officials routinely reject the idea they target stock prices in their policy deliberations. To the extent an equity fall would influence policy makers, it would have be very sharp and threaten to destabilize the financial system and the broader economy.
No comments from Fed officials over recent weeks have suggested officials are overly alarmed about what’s been happening in markets. Mr. Fisher even welcomed the declines as a sign markets are pricing equities in better alignment with the economy’s fundamentals.
WSJ reporter Michael Derby forgot to add the words "going forward" to the end of that last sentence, because those are the economic fundamentals that matter where stock prices are concerned. For people who pay attention to stock prices, the present is only where we live.
Labels: chaos, dividends, forecasting, SP 500, stock market
Welcome to the blogosphere's toolchest! Here, unlike other blogs dedicated to analyzing current events, we create easy-to-use, simple tools to do the math related to them so you can get in on the action too! If you would like to learn more about these tools, or if you would like to contribute ideas to develop for this blog, please e-mail us at:
ironman at politicalcalculations
Thanks in advance!
Closing values for previous trading day.
This site is primarily powered by:
CSS Validation

RSS Site Feed
JavaScript
The tools on this site are built using JavaScript. If you would like to learn more, one of the best free resources on the web is available at W3Schools.com.
Other Cool Resources
Blog Roll


