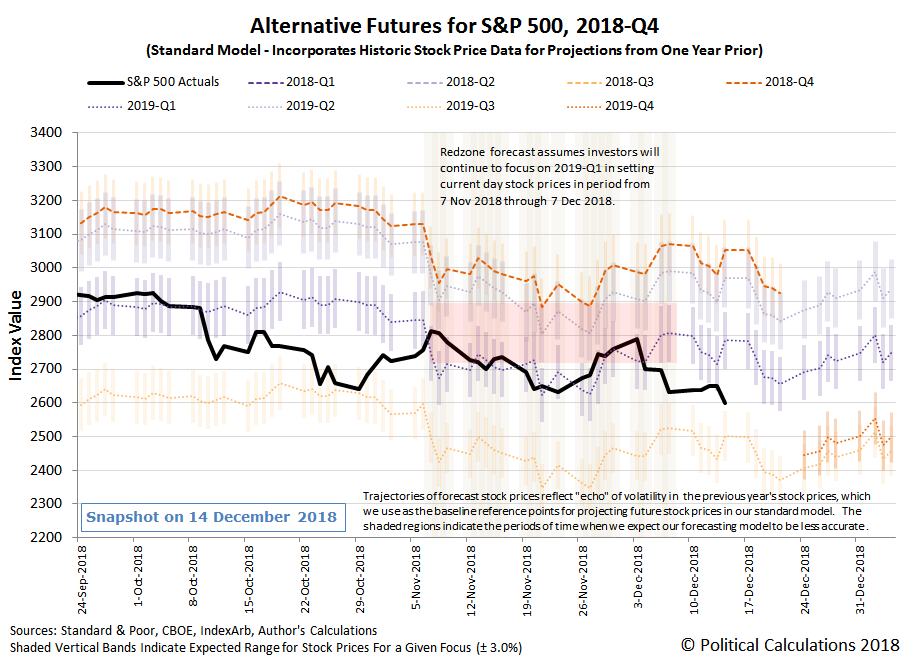
As we enter the final full week for trading in 2018, we find that S&P 500 (Index: SPX) investors appear to be splitting their forward-looking attention between the first and third quarters of the new year in setting today's stock prices.
We believe the reason for this split is two-fold. First, political control of the U.S. House of Representatives is changing from the Republican party to the Democrat party in 2019-Q1, which will come with a host of policy changes that can impact the outlook for businesses and the economy depending upon how far they might be expected to advance.
Second, investor concerns about the Fed's plans for future rate hikes are now at elevated levels because of the recent partial inversion of the U.S. Treasury yield curve. Further Fed rate hikes can only exacerbate that situation and increase the likelihood of a recession given the current market environment, where the Fed is expected to hike rates by a quarter point later this week. The bigger question is how many more hikes will follow in 2019?
A month ago, investors had been anticipating two rate hikes in 2019, one in March 2019 and another in September 2019, following the long anticipated hike in December 2018. Two weeks ago, investors were betting on the scenario that there would be at least one hike in the next year, coming in June 2019.
In a sign of how rapidly expectations for the future are changing, as of Friday, 14 December 2019, the CME Group's FedWatch Tool is still forecasting just one Fed rate hike in 2019, which has been pushed out into September 2019. The following image captures the FedWatch Tool's estimated probabilities for rate hikes by amount and date, which indicates that there is a greater than 50% probability that the Fed will hike its Federal Funds Rate to the 2.50-2.75% (or 250-275 basis points) range or higher at the conclusion of its 18 September 2019 meeting during 2019-Q3.
Although the red-highlighted sections of the chart indicate the rate hike occurring after the Fed's 30 October 2019 meeting (in 2019-Q4), summing the probabilities that the Federal Funds Rate hike will be 2.50%-2.75% or higher at the Fed's 18 September 2019 meeting confirms that investors are currently giving better-than-even odds of Fed rate hike at this earlier date. As we noted before, these expectations have been evolving rapidly in recent weeks, where perhaps the CME Group's tabulator has gotten a bit ahead of the curve....
That said, this is the last edition of our S&P 500 Chaos series until 2019, unless market events prompt a special edition. Otherwise, we'll return with a year-end catch-up edition in early January 2019! Until then, here are the major market-moving headlines for the week that was Week 2 of December 2019.
- Monday, 10 December 2018
- Tuesday, 11 December 2018
- Oil pares gains on threatened U.S. government shutdown
- China, U.S. discuss road map for next stage of trade talks
- Trump says 'very productive' talks with China
- White House expects China to cut car tariffs after trade call: auto executive
- S&P 500, Dow edge lower as U.S. shutdown threat, China trade in focus
- Wednesday, 12 December 2018
- Oil ends lower on Iran comments despite Libya, OPEC supply cuts
- U.S. mortgage activity hits 2-month high as interest rates fall: MBA
- China preparing plan to increase access for foreign companies: WSJ
- Exclusive: Trump says Fed shouldn't hike rates, but calls Powell 'a good man'
- Wall Street closes up, investors optimistic on China trade
- Thursday, 13 December 2018
- Friday, 14 December 2018
Barry Ritholtz has outlined the positives and negatives among the week's major economics and markets-related news over at The Big Picture.
On a more general publishing note, Political Calculations will be covering a handful of stories this week before signing off for our annual hiatus until 2019, including an update for our U.S. recession probability estimates following the Fed's meeting on Thursday and also the biggest math story of 2018 as our final post of 2019, which we haven't yet scheduled - all we know right now is "before Christmas arrives". Thank you for reading, and have a wonderful holiday season!
Welcome to the blogosphere's toolchest! Here, unlike other blogs dedicated to analyzing current events, we create easy-to-use, simple tools to do the math related to them so you can get in on the action too! If you would like to learn more about these tools, or if you would like to contribute ideas to develop for this blog, please e-mail us at:
ironman at politicalcalculations
Thanks in advance!
Closing values for previous trading day.
This site is primarily powered by:
CSS Validation
RSS Site Feed
JavaScript
The tools on this site are built using JavaScript. If you would like to learn more, one of the best free resources on the web is available at W3Schools.com.

