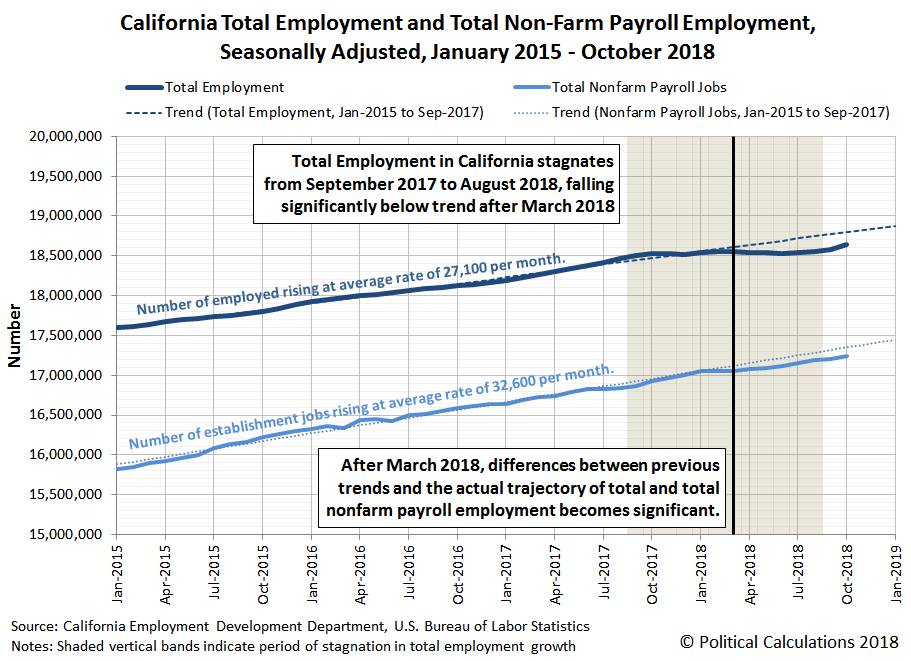
After growing at an average rate of 27,100 employed people per month from January 2015 to September 2017, California's total employment stalled out at a level just over 18.5 million in the 12 months from September 2017 to August 2018 before finally resuming an upward trajectory.
That observation started us digging into the state's employment data, where we were looking to identify distressed industries within the state, specifically looking for economic sectors that might have been losing jobs as others were gaining them, which would account for the period of stagnation.
After looking the data over, the leading candidates were the state's Mining and Logging sector(which includes Oil Extraction), the Construction sector, and California's catch-all "Other Services" economic sector. But the job numbers we saw in these industries didn't explain the full magnitude of the deviation in trend of the state's total employment level that occurred during this time.
That's when it occurred to us that we were comparing apples and oranges, where the total employment data comes from the Bureau of Labor Statistics' monthly survey of U.S. households, while the industrial employment figures represent the number of jobs counted in the BLS' monthly survey of U.S. business establishments.
As it happens, we have some experience with that topic, where top Google search result for the difference between household and establishment survey currently returns an article that we wrote several years ago.
It occurred to us that we could use the difference between the kinds of employment data collected between the two surveys to determine if the apparent stagnation in California's total employment level from September 2017 through August 2018 could be partially accounted for by changes in non-establishment employment, which could potentially explain the gap.
So we took both sets of seasonally-adjusted data and graphed them on the same chart, projecting the linear trend for each that was established in the period before the period of stagnation in the total employment data took hold in September 2017. We found something remarkable.
Both total employment and nonfarm establishment jobs in California grew steadily in the period from January 2015 through September 2017. While the total employment level began to stagnate at that point, the number of filled jobs at establishments continued to grow until January 2018, after which it began to flatten. After March 2018, both series of data deviate significantly from their established linear trends, where the trajectory of total employment data shows a bigger negative deviation than the total nonfarm payroll data.
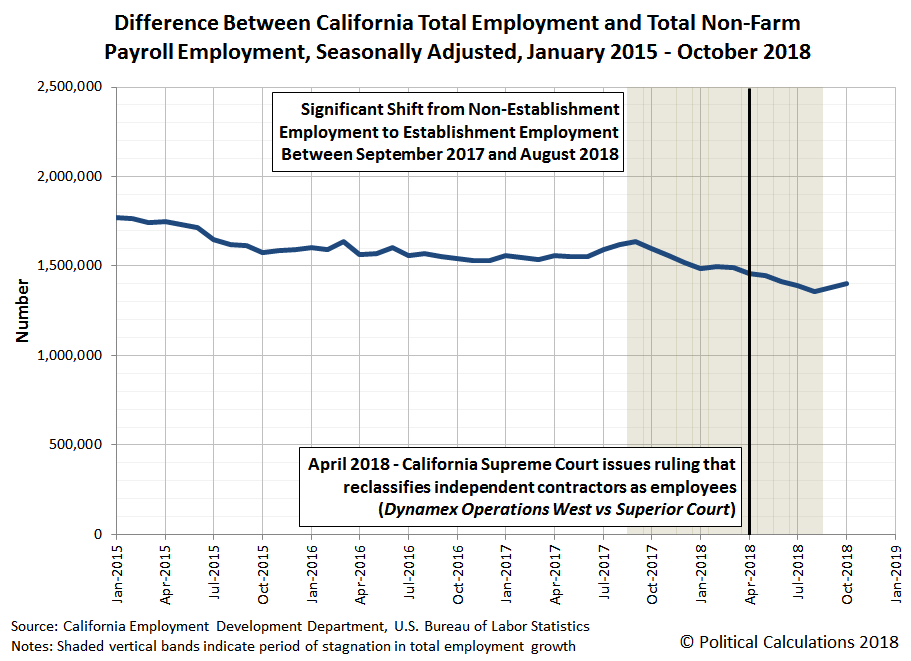
What this data tells us is that there was a notable shift, beginning in September 2017 and more notably after March 2018, where Californians employed outside of business establishments in the state shifted to become payroll employees. The following chart shows the difference between the two data series (note that this math can only produce at best a rough estimate of the change given the differences in the types of employment data involved - the two sets of data do not fit precisely together like puzzle pieces).
The chart also marks the timing of a powerful explanation for the deviation from previous trend that we observe after March 2018. In April 2018, the California Supreme Court ruled in Dynamex Operations West, Inc. vs Superior Court that many Californian employers would have to reclassify many workers who they had previously employed as independent contractors under Californian state law as regular employees, putting them on their establishment's payrolls.
The court's arbitrary ruling was expected to cause "massive disruption to California's gig-economy employers", where the significant deviation from previous trend for both total employment and total nonfarm payroll jobs after March 2018 suggests occurred.
That doesn't explain the shift that appears to have occurred from September 2017 to March 2018, but that period also roughly coincides with the peaking and subsequent decline of California's housing market that has largely been driven by the Federal Reserve's recent series of rate hikes. This sector of California's economy coincidentally employs about one out of every five independent contractors in the state, where the decline of the market may have prompted many of these Californians to stop being their own boss and start working on someone else's payroll.
Although all the employment data we've presented in this post is still subject to future revision, it does suggest that California's gig-economy did experience a court-ordered disruption during 2018. That same preliminary data also suggests that the period of adjustment may now be over, but we won't know for sure that's the case for quite some time.
Labels: jobs, real estate, recession
Welcome to the blogosphere's toolchest! Here, unlike other blogs dedicated to analyzing current events, we create easy-to-use, simple tools to do the math related to them so you can get in on the action too! If you would like to learn more about these tools, or if you would like to contribute ideas to develop for this blog, please e-mail us at:
ironman at politicalcalculations
Thanks in advance!
Closing values for previous trading day.
This site is primarily powered by:
CSS Validation
RSS Site Feed
JavaScript
The tools on this site are built using JavaScript. If you would like to learn more, one of the best free resources on the web is available at W3Schools.com.


