If you had to pick one aspect of nearly American life that would be most measurably impacted by 2020's coronavirus pandemic, what would you choose?
We've been through the 2020 Consumer Expenditure Survey, which gives the answer: food! Specifically, the change in how much Americans spent on food to eat away from home. The various pandemic lockdown measures imposed by various state and local governments forced many restaurants to shut down for prolonged periods. When they were allowed to reopen, many were forced to limit how many customers they were allowed to accommodate.
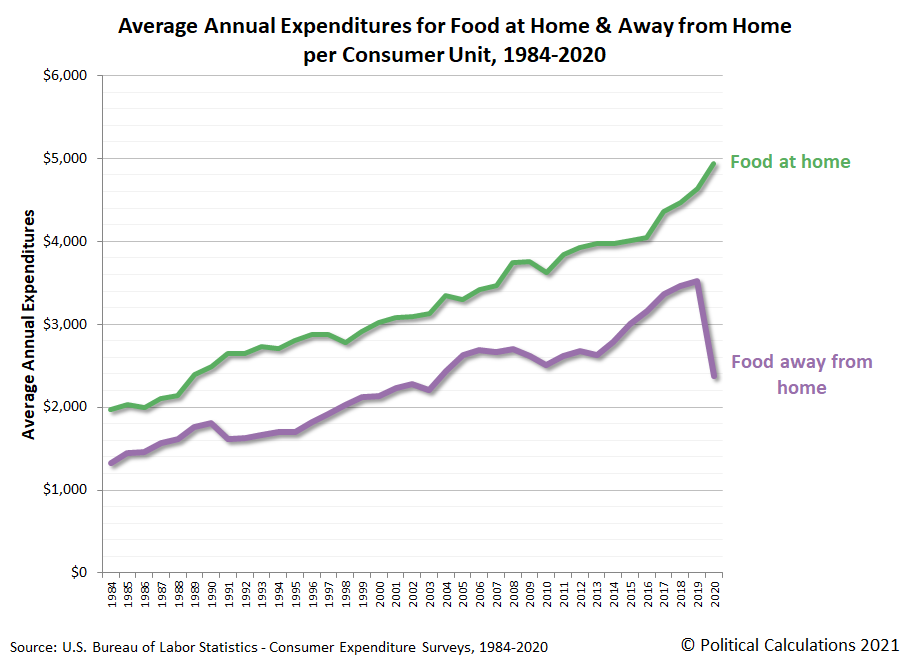
The following chart shows how those lockdown measures and restrictions impacted the trends for the average amount of money Americans spend on dining out. For reference, the chart also shows the amount Americans spend on average each year to eat at home.
In 2019, Americans spent an average of $4,643 on food to eat at home and $3,526 on food away from home. In 2020, the amount spent on food at home increased $299 (6.4%) to $4,942. But the average amount of money spent to dine out plunged by $1,151, or 32.6%, to $2,375.
Although it represents the biggest average annual dollar decline in a category of spending, in terms of percentage decline, the amount of spending on food away from home represents the third biggest drop recorded from 2019 to 2020. There are two other categories of consumer spending that plunged by larger amounts in percentage terms, but they involve far less average spending per consumer unit "household".
The second biggest percentage decline occurred in the amount of money Americans spent on fees and admissions, such as to sporting or other entertainment events, which dropped by 51.7% from $880 in 2019 to $425 in 2020.
The biggest percentage decline however was recorded for public transportation. Here, the average annual amount spent went from $781 in 2019 to $263 in 2020, a 66.3% reduction. This category of spending includes transportation via bus and light rail systems, which proved to be a major contributor to the spread of coronavirus infections in the epicenter of New York City early in the pandemic. It also includes commercial air transportation, where reduced demand for air travel and restrictions on how many people were allowed to board aircraft greatly reduced the amount of money spent on this class of public transportation.
References
U.S. Bureau of Labor Statistics. Consumer Expenditure Survey. Multiyear Tables. [PDF Documents: 1984-1991, 1992-1999, 2000-2005, 2006-2012, 2013-2020]. Accessed 9 September 2021.
Labels: coronavirus, food, personal finance
Welcome to the blogosphere's toolchest! Here, unlike other blogs dedicated to analyzing current events, we create easy-to-use, simple tools to do the math related to them so you can get in on the action too! If you would like to learn more about these tools, or if you would like to contribute ideas to develop for this blog, please e-mail us at:
ironman at politicalcalculations
Thanks in advance!
Closing values for previous trading day.
This site is primarily powered by:
CSS Validation
RSS Site Feed
JavaScript
The tools on this site are built using JavaScript. If you would like to learn more, one of the best free resources on the web is available at W3Schools.com.
