The Chinese government's execution of its zero-COVID policy has slammed trade between the U.S. and China. To recap, after surging in February, the growth rate of U.S. exports to China slowed to single digits in March 2022. One month later, they've fallen through the floor and shrunk year over year.
That much is evident in the newest update to our chart tracking the year-over-year growth rate of exchange rate-adjusted U.S.-China trade. The chart now covers the modern era for trade between the two nations from January 1986 through the just released data for April 2022.
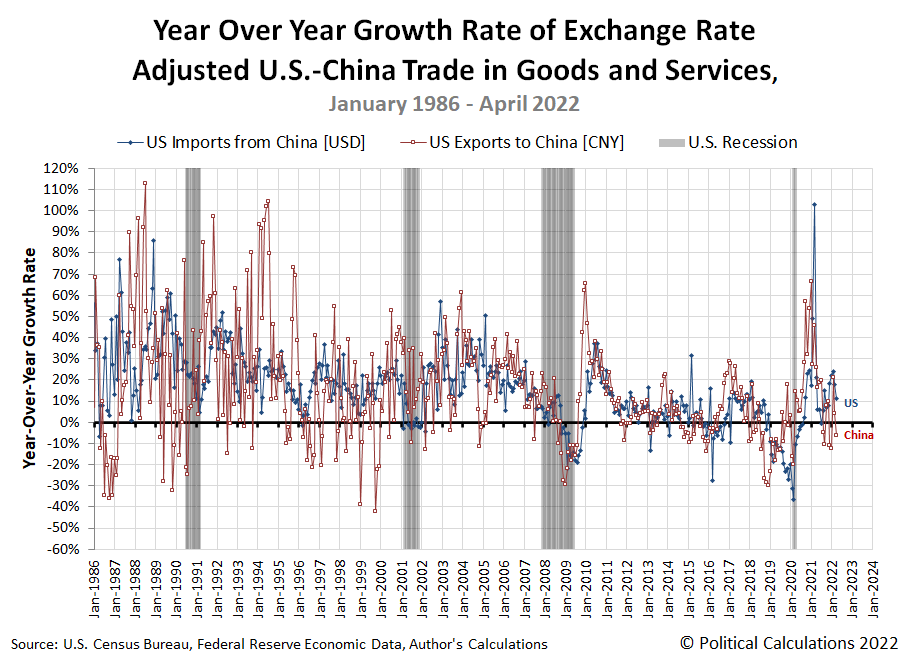
In this chart, we see the growth rate of U.S. exports to China has plunged into negative territory, recessionary territory in April 2022. By contrast, China's exports to the U.S. fell below the level of recent months, but still recorded double-digit year-over-year growth as progress is being made in reducing the backlog of Chinese goods waiting to be unloaded in U.S. ports. Given China's plunging exports in March and April 2022, that long-running backlog is now propping up the volume of Chinese goods coming into the U.S.
Looking at the combined value of goods exchanged between the two countries, we find little change in its trailing twelve month average, shown by the heavy black line in the following chart. The gap between that trajectory and the post-pandemic trade recovery counterfactual shown by the dashed red line held steady at $0.3 billion in April 2022.

Looking forward, we know from the available atmospheric carbon dioxide concentration data that global economic activity picked up in May 2022, which is backed by preliminary Chinese trade data for the month. Looking further forward, the continued lifting of COVID lockdowns in China should boost growth into June 2022 as well, which we should see through increased U.S. exports to China and in upcoming months.
References
U.S. Census Bureau. Trade in Goods with China. Last updated: 7 June 2022. Accessed 7 June 2022.
Labels: trade
Welcome to the blogosphere's toolchest! Here, unlike other blogs dedicated to analyzing current events, we create easy-to-use, simple tools to do the math related to them so you can get in on the action too! If you would like to learn more about these tools, or if you would like to contribute ideas to develop for this blog, please e-mail us at:
ironman at politicalcalculations
Thanks in advance!
Closing values for previous trading day.
This site is primarily powered by:
CSS Validation

RSS Site Feed
JavaScript
The tools on this site are built using JavaScript. If you would like to learn more, one of the best free resources on the web is available at W3Schools.com.
Other Cool Resources
Blog Roll


