From time to time, we come across data that's interesting in and of itself as we work on various projects. Worldwide coal consumption is one such data series that stands out because coal is a leading source of carbon dioxide in the Earth's atmosphere, which we pay attention to because of its value as an economic indicator.
We've explored worldwide coal consumption before, but only over the last few years worth of available data. So today, we're going to extend the limited picture we've presented all the way back to 1965, which is long enough to capture a number of interesting trends.
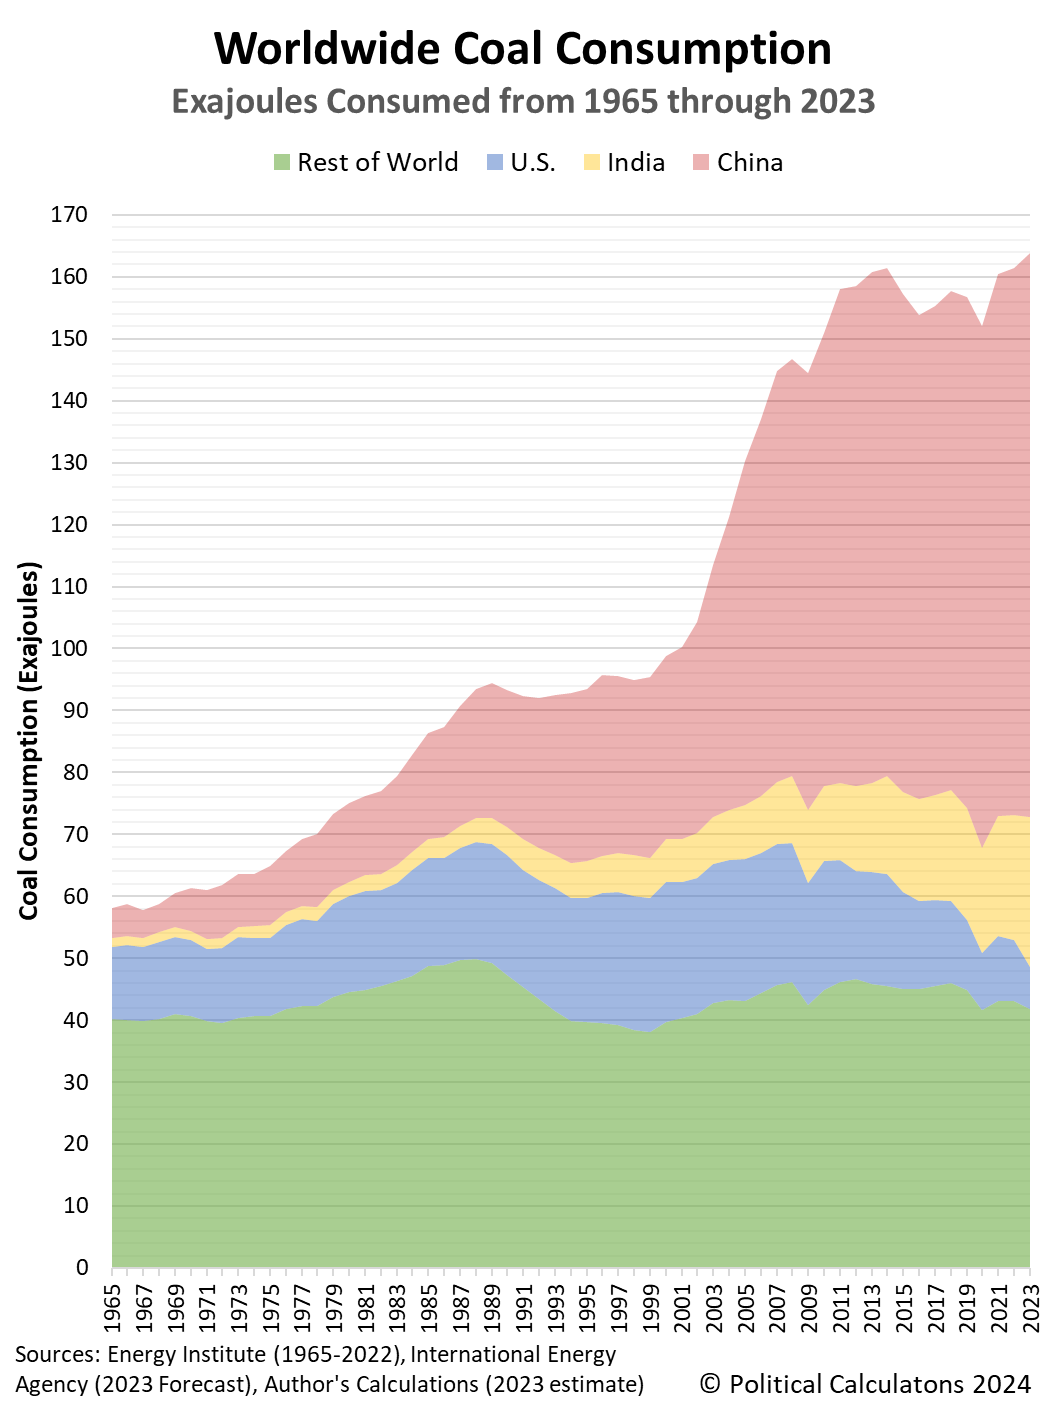
As a bonus, we'll tack on the latest estimates for 2023's worldwide coal consumption, which will make the data series as completely current as we can make it. The following chart illustrates the total number of exajoules of energy extracted from coal consumption for the world's top three national consumers of coal and the rest of the world from 1965 through 2023.
Starting with the big picture, based on current estimates, more exajoules of coal were consumed in 2023 than any other in history. Coal consumption has been rising in each year since the global coronavirus pandemic year of 2020. If its projection holds, 2023's worldwide coal consumption breaks the record set in 2013.
China is, by a very wide margin, the world's largest consumer of coal. China's consumption of coal exploded after 1999 and has more than tripled through 2023.
India has expanded its consumption of coal much more slowly over the decades covered in the data, but has more than quadrupled its consumption since 1996. Although its population has grown to exceed that of China, India recorded a little over 26% of China's total consumption of coal in 2023.
The United States is historically the world's largest consumer of coal, but the nation has greatly reduced its consumption since it peaked in 2005. In 2023, U.S. annual coal consumption has dropped by 70% from that peak.
Meanwhile, the rest of the world looks like its coal consumption has mostly been flat over the past six decades. In truth, that lack of apparent growth hides several major factors that have affected the world's coal consumption. For example, the collapse of the Soviet Union and the dissolution of its empire in 1991 reversed what had been a rising trend before that time. Meanwhile, the nations of the European Union have collectively reduced their coal consumption since it peaked in 1985.
But to make for an apparently flat trend, other nations have increased their consumption of coal over this period. In recent years, Indonesia and Vietnam stand out for the growth of their coal usage.
All these subglobal trends have combined to produce the overall pattern for worldwide coal consumption. The period from 1965 through 1991 saw a rising trend, which flattened out between 1991 and 1999, only to see coal consumption expand rapidly because of China's explosive growth up through 2011. The period since 2011 however has been generally flat with the world ranging between 152 and 164 exajoules worth of annual coal consumption.
2023's estimated worldwide coal consumption is over 2.8 times higher than 1965's coal consumption.
Reference
Energy Institute. Statistical Review of World Energy (2023). [Excel Spreadsheet]. 26 June 2023.
International Energy Agency. Coal 2023. [PDF Document]. 15 December 2023.
Labels: data visualization, economics, environment
Welcome to the blogosphere's toolchest! Here, unlike other blogs dedicated to analyzing current events, we create easy-to-use, simple tools to do the math related to them so you can get in on the action too! If you would like to learn more about these tools, or if you would like to contribute ideas to develop for this blog, please e-mail us at:
ironman at politicalcalculations
Thanks in advance!
Closing values for previous trading day.
This site is primarily powered by:
CSS Validation
RSS Site Feed
JavaScript
The tools on this site are built using JavaScript. If you would like to learn more, one of the best free resources on the web is available at W3Schools.com.
